TL;DR
Retail self-service analytics should be measured by whether users reach usable answers with less rework, not by dashboard volume alone. PAYBACK’s example shows why shared definitions, access controls, source evidence, and a clear escalation path matter when campaign teams need to move from report to decision.
From Coupon Counts to Answers That Drive Decisions
A loyalty manager can already see total coupon redemptions, but the real question is why certain stores underperformed. Was it a stock issue? A timing issue? A customer eligibility issue? Or did the campaign simply fail to drive the expected behavior?
Answering that follow-up usually means another report request.
By the time the answer arrives, the next promotion may already be underway.
That is the practical problem self-service analytics is supposed to solve. The value is not just giving users another dashboard. It is helping business teams investigate approved data, ask the next question, and move toward a decision without waiting for every variation to become a specialist request.
PAYBACK’s experience offers a useful example for retail marketing, loyalty, and analytics leaders thinking about what effective self-service should look like.
What PAYBACK Changed
According to ThoughtSpot’s PAYBACK customer story, PAYBACK’s earlier reporting environment required technical intervention even for small adjustments. Reporting backlogs delayed answers, and users relied on email and spreadsheets to get the views they needed.
With ThoughtSpot, employees could explore coupon performance at individual stores on specific days in near real time. The story also describes independent performance monitoring across retail partners and more time for analysts to focus on strategic work.
PAYBACK’s reported self-service footprint included:
- 70+ major retail partners
- 300+ user-created Liveboards
- 150 standard reports
These figures are useful as adoption indicators, but they should not be read as active-user rates, answer accuracy measures, or financial return. They show scale and content creation, not the full quality of decision-making.
That distinction matters.
Self-service analytics should not be evaluated only by the number of dashboards or reports created. A better question is whether users can reach usable answers with less rework, while still relying on shared definitions, appropriate access, and evidence they can inspect.
The Real Test Is the Follow-Up Question
Retail teams rarely stop at the first answer.
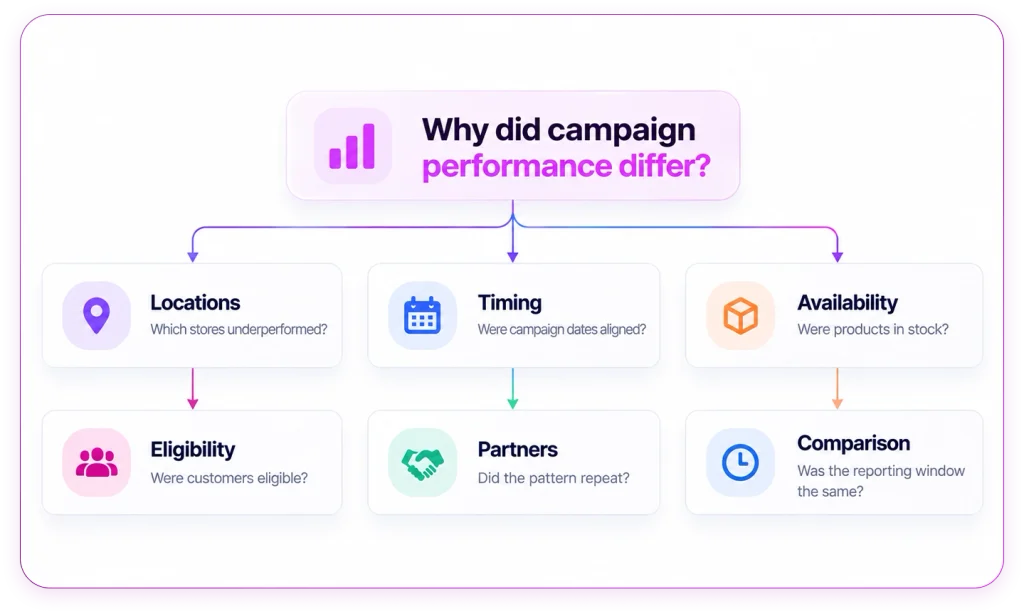
A campaign dashboard may show that one store group had lower coupon redemptions. But the next questions come quickly:
Which locations underperformed?
Were campaign dates aligned?
Were the products available?
Were customers eligible?
Did the same pattern appear across partners?
Was the comparison based on the same reporting window?
Before interpreting the result, the team also needs to agree on the measure itself. “Redemption rate” can mean different things depending on the denominator. It could be issued coupons, activated offers, or eligible customers.
If those definitions are unclear, self-service can spread confusion faster than traditional reporting ever did.
This is where retail analytics needs more than access. It needs a workflow that helps users understand what they are asking, what data is being used, and whether the answer is reliable enough to support action.
Why Self-Service Still Needs Guardrails
Self-service analytics does not remove the need for analysts, definitions, or governance. It changes where those controls need to show up.
A business user should be able to explore approved data without opening a ticket for every follow-up. But that exploration still needs boundaries.
The system should help users confirm:
- which metric definition is being used
- which dates and stores are included
- which source data supports the answer
- whether the user has access to the right scope
- when the question needs analyst review
For example, a stock shortage may call for an operational fix. A question about whether a promotion drove incremental sales may require a comparison group and deeper analyst support. Higher redemptions alone do not prove incremental revenue.
A useful self-service workflow should make that distinction clear.
A Better Way to Pilot Self-Service Analytics
For retail teams evaluating self-service analytics, the best pilot does not start with a broad rollout. It starts with one recurring campaign question that already creates reporting friction.
For example:
Which stores underperformed during our latest coupon campaign?
From there, the team can test the workflow end to end.
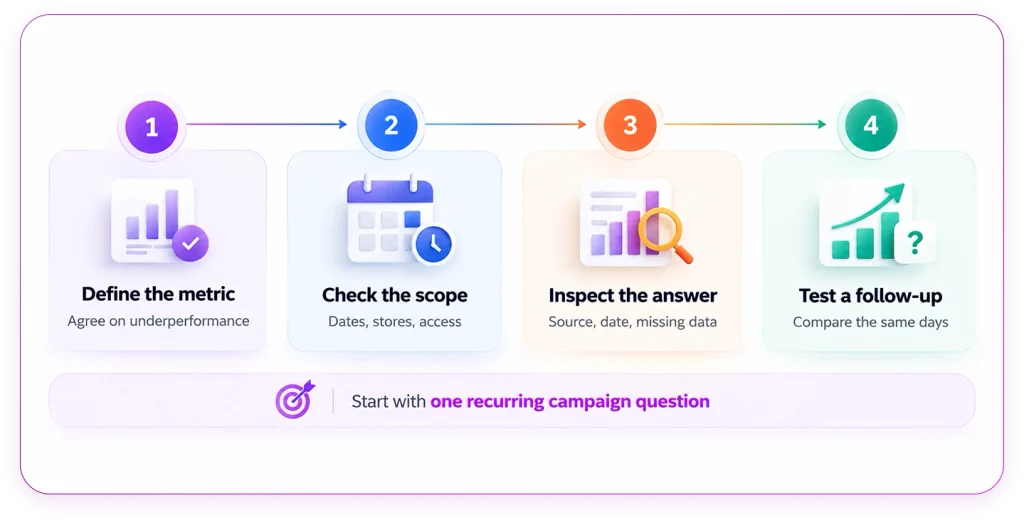
Figure 2 A pilot that follows the question through to review.
Start by defining the metric. Confirm what “underperformance” means and how the calculation is handled.
Next, check the scope. Confirm campaign dates, eligible customers, participating stores, and user permissions.
Then inspect the answer. Review the source, metric definition, reporting date, and any missing information.
Finally, test a follow-up that changes the decision. For example:
Does the difference remain when we compare the same campaign days?
This kind of pilot is more useful than a polished demo because it shows whether the system can support a real business investigation.
Measure Useful Independence
A strong self-service pilot should not only ask whether users can create more views. It should measure whether users reach better answers with less rework.
Before the pilot begins, teams should agree on success criteria.
Useful measures include:
- time from question to reviewed answer
- routine questions resolved without a specialist ticket
- answers accepted without correction
- users returning for later analysis
- answers linked to a documented business decision
This creates a more practical basis for expansion than dashboard count alone.
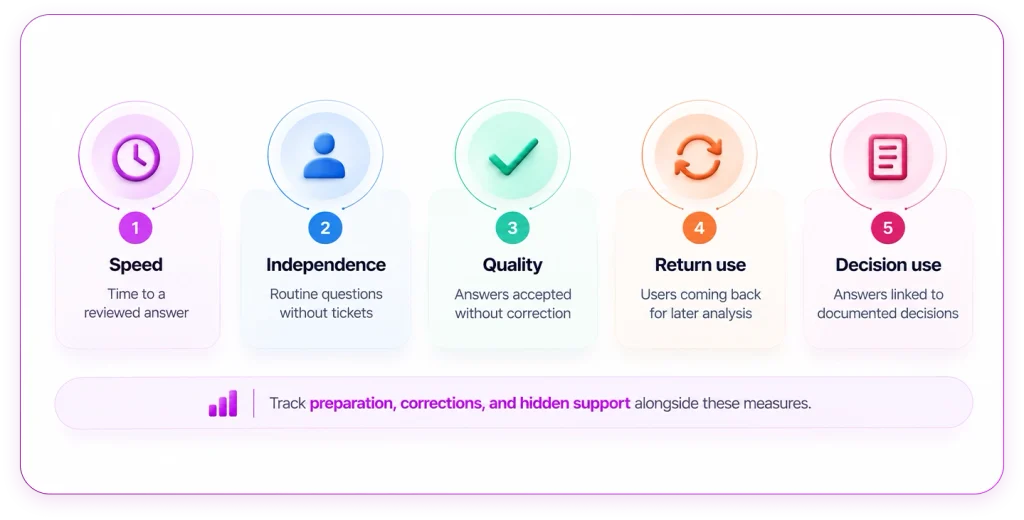
It also keeps teams honest. A shorter reporting queue is only useful if the work has not simply moved elsewhere, into more preparation, more corrections, or more hidden support from analysts.
Where QuaerisAI Fits
QuaerisAI helps teams connect business questions to definitions, source traceability, and access controls.
For retail and CPG teams, that can support use cases across merchandising, inventory, demand, and trade-promotion analysis. The useful test is not whether the platform can answer a polished demo question. The useful test is whether it can support the way campaign teams actually investigate performance across the systems they already use.
A QuaerisAI demo should make the answer inspectable.
For a question like “Which stores underperformed during our latest coupon campaign?”, the review should show:
- how underperformance is defined
- which source data supports the answer
- which dates and stores are included
- what scope the user is allowed to see
- whether the evidence is strong enough to act on
- when a follow-up requires analyst review
That is the difference between self-service as dashboard access and self-service as a decision workflow.
Give the Next Question a Clear Path
Retail analytics does not fail because teams lack dashboards. It often fails because the next question has nowhere clean to go.
Self-service works when users can continue a useful investigation, understand the answer, and recognize when specialist help is needed.
Start with one campaign question that repeatedly returns to the reporting queue. Define what a trustworthy answer requires. Then test the workflow against it.
Bring one recurring campaign question to a QuaerisAI demo. Review the metric definition, source data, access scope, and follow-up workflow behind the answer.