Category: Business Intelligence

  • 6 Data Analytics Tools to Consider in 2026

    6 Data Analytics Tools to Consider in 2026

    Choose the right workflow for the question you need to answer

    TL;DR: Choose an analytics tool based on the question, the data and who needs to check the result. Excel suits workbook calculations; SQL helps inspect database records; Python with pandas supports repeatable data preparation; Power BI and Tableau support shared reporting and visual analysis; and QuaerisAI supports questions across governed business data. These tools can work together. Test one real business question, then compare correctness, permissions, source traceability and repeatability before choosing a workflow.

    Your dashboard shows more leads. Sales says the leads are weaker. Finance wants to know whether the extra spend paid off.

    At that point, the question is not just which analytics tool to open. The better starting point is understanding the question, the available data, and who needs to check the result.

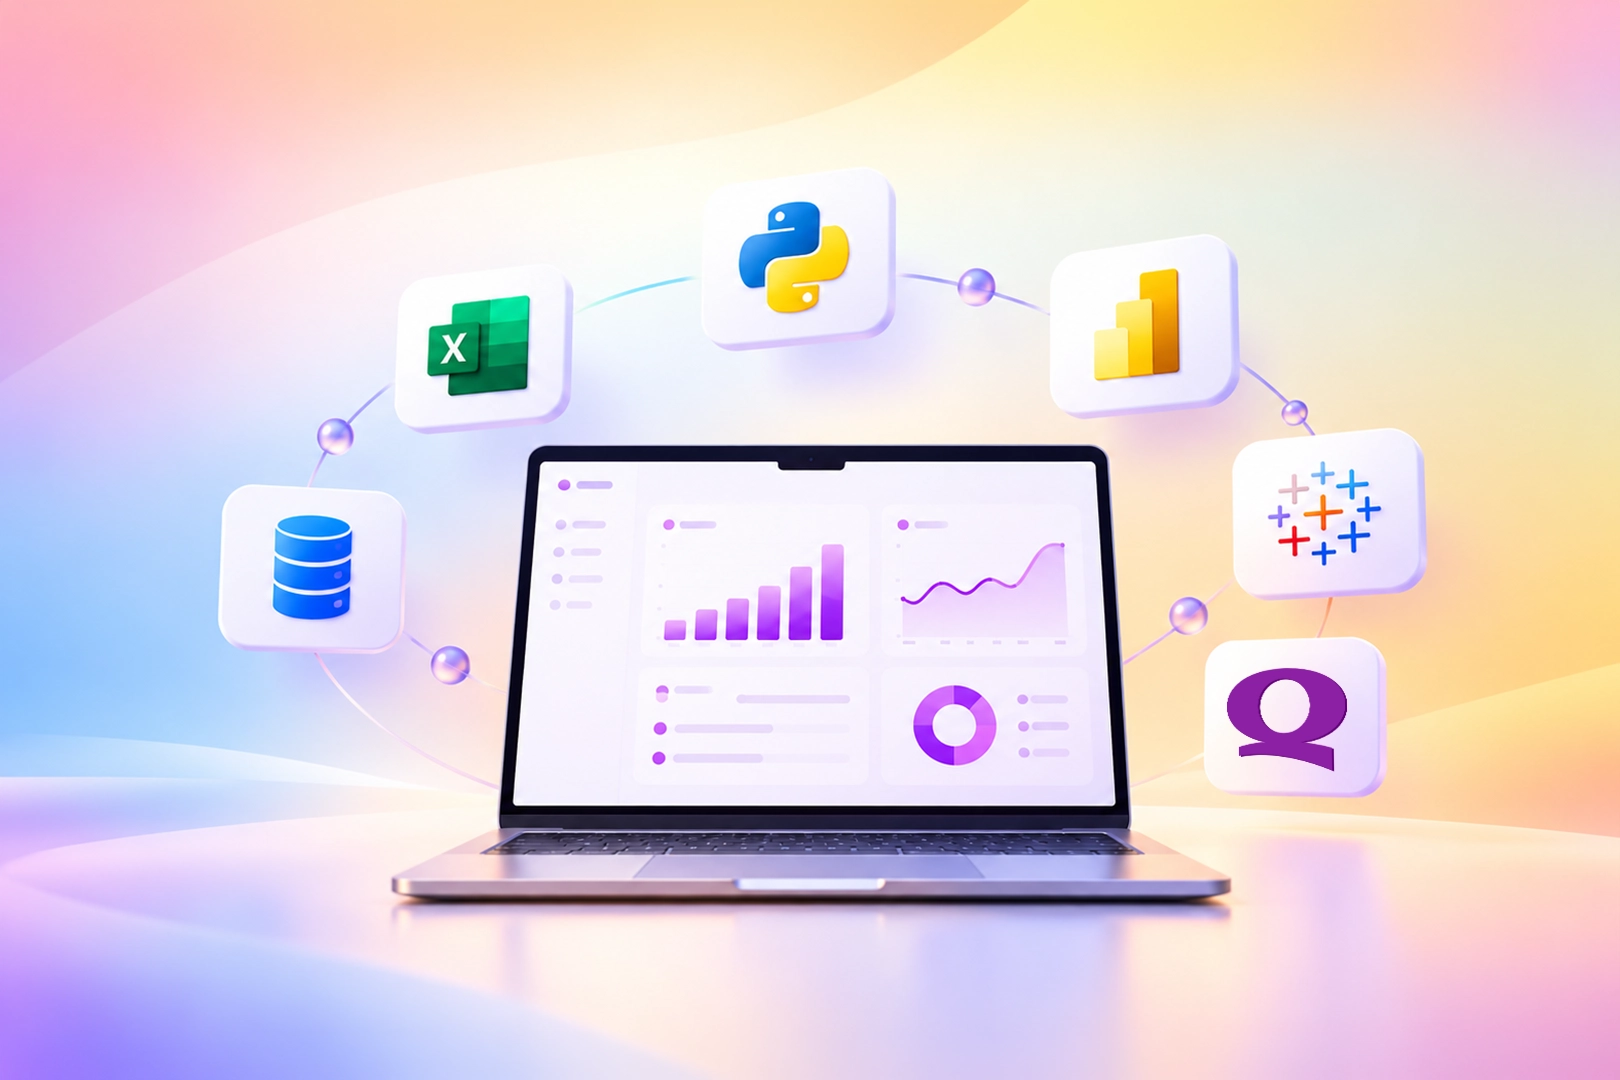
    Excel, Power BI, Tableau, SQL, Python, and QuaerisAI can all support analytics work, but they serve different purposes.

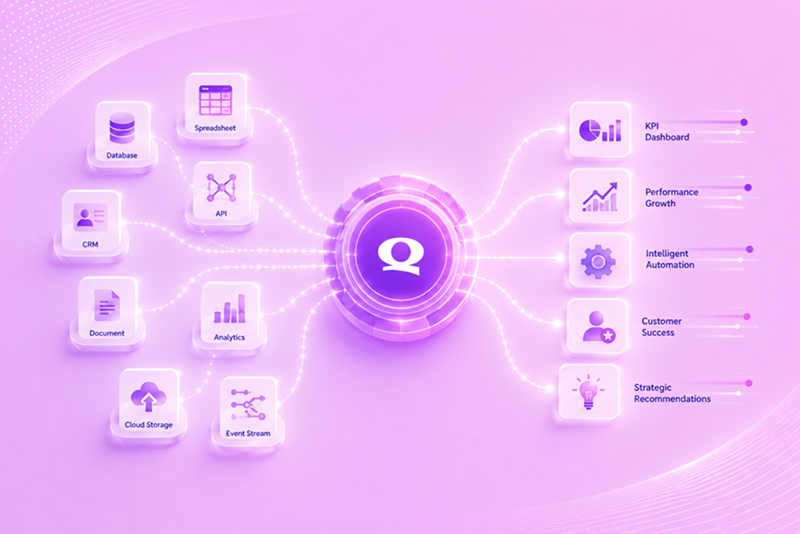
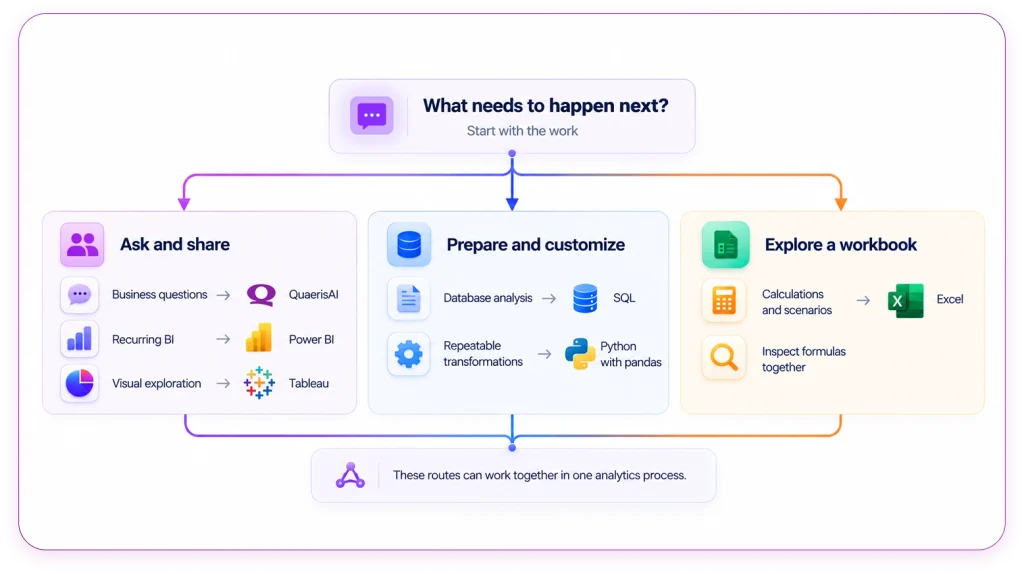
    Excel is useful for workbook-based investigations. Power BI and Tableau support shared reporting and visual analysis. SQL and Python help analysts prepare, test, and transform data. QuaerisAI supports questions across governed business data.

    These workflows can complement one another in the same analytics process.
    This guide is an editorial shortlist, not a performance benchmark. QuaerisAI is included because it is our offering, but the numbering does not indicate rank.

    Compare the job before comparing the product
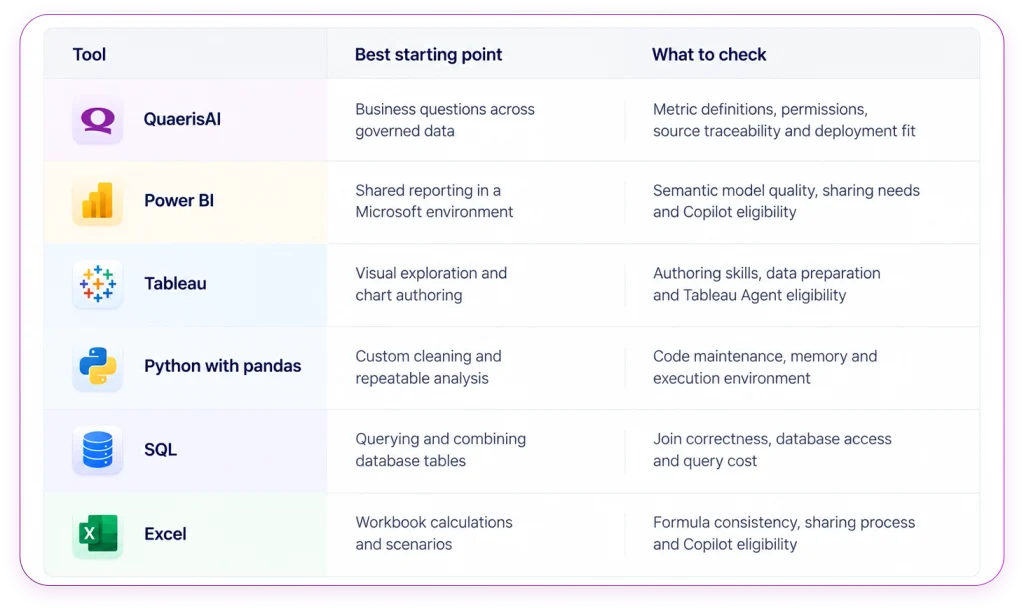
    Analytics work usually moves through preparation, calculation, reporting, and investigation.

    Different tools are stronger at different stages. Before comparing products, compare the job the team needs to do.

    The point is simple: start with the work, then choose the tool.

    A team inspecting workbook formulas has a different need from a team governing metric definitions across departments. A data analyst checking joins has a different job from a business user asking why a campaign changed.

    The wrong tool may still produce an output. The better tool gives the team a result they can understand, check, and repeat.

    A language and a platform are different decisions

    Python and SQL should not be evaluated in the same way as BI platforms.

    Python is a programming language. pandas is an open-source Python library for working with data. SQL is a language used to query databases. They are powerful, but they still require an execution environment, maintenance, access controls, and people who can review the work.

    AI assistance can make coding and querying faster, but it does not automatically turn Python or SQL into governed analytics products.

    For buyers, the practical question is whether the team can maintain the workflow, control access, check the logic, and repeat the result later.

    Start with the question your current setup cannot answer

    Most organizations already have analytics tools. The real buying question is usually about the gap.

    What question is your current setup struggling to answer?

    For some teams, the issue is exploration. Users can see a dashboard, then struggle to ask the next question.

    For others, the issue is repeatability. A useful analysis exists, but it depends on one analyst, one script, or one workbook.

    For regulated or enterprise teams, the issue may be traceability. The result exists, but the team cannot clearly show which definition, source, permission, or calculation produced it.

    A good evaluation should start with a specific workflow, not a generic feature checklist.

    Ask:

    Who asks the question?

    Who owns the metric?

    Who fixes the data?

    Who checks the result?

    Can the workflow be repeated?

    The answers will show where the bottleneck sits.

    Where each tool earns its place

    1. QuaerisAI for governed business questions

    Evaluate QuaerisAI when business users need to ask questions across governed enterprise data.

    A useful test is to start with an ambiguous term such as active customer. Ask the system to define the metric, show the source, and repeat the question with a restricted user.

    The goal is to see whether the workflow respects definitions, permissions, and traceability.

    This is especially relevant when teams need results that can be checked later, rather than one-off outputs that are difficult to reconstruct. [2, 3]

    2. Power BI for shared reporting and follow-up analysis

    Consider Power BI when reports and semantic models already support your Microsoft workflow.

    Power BI is useful for shared dashboards, recurring reporting, and business reviews where the organization has already invested in semantic models and permissions.

    Copilot can assist with reporting, summaries, and data questions, but the experience still depends on the underlying model, capacity eligibility, and enablement.

    A practical test is to use a trusted measure and check whether users can understand the result, share it appropriately, and continue the analysis without creating confusion. [4]

    3. Tableau for visual investigation

    Tableau supports visual investigation and chart authoring.

    It is useful when users need to compare regions, change measures, and inspect how a visual changes when the view changes.

    Tableau Agent can assist with charts, calculations, and filters, but teams should confirm supported operations, deployment eligibility, and access in their own environment.

    A useful test is to request a regional comparison, change the measure, and inspect what stayed constant. [5]

    4. Python with pandas for repeatable data preparation

    Use Python with pandas for recurring cleaning, joins, grouping, reshaping, and tabular analysis.

    It is flexible, but it still needs maintenance. Someone must review the code, manage changes, check AI-generated edits, and test edge cases such as missing values or duplicates.

    The main risk is treating a script as reliable just because it runs.

    A good workflow checks the data before trusting the totals. [6]

    5. SQL for examining the data behind the result

    SQL helps analysts filter, join, and aggregate structured database tables.

    It is useful for checking the data behind reports, dashboards, and AI-generated outputs. It can also help confirm whether the right records are included in a result.

    The common risk is join logic. A query can multiply transactions, exclude records, or produce a misleading total if the relationships are wrong.

    SQL gives control, but it does not guarantee correct analysis by itself. [7]

    6. Excel for collaborative workbook analysis

    Excel supports formula inspection, scenario analysis, and workbook-based collaboration.

    It is familiar and flexible, especially for finance and planning workflows where teams need to see the calculation directly.

    Copilot can assist in Excel depending on license, app, and configuration. Teams should still keep a known reference calculation and review changes before sharing.

    Recurring workbooks need ownership, version control, and review discipline. [8]

    What 2026 research changes about the buying decision

    Enterprise AI adoption is moving from isolated experiments toward broader deployment.

    McKinsey’s August 2026 survey reported enterprise AI scaling rising from 38 percent to 44 percent of respondents. This describes broader adoption, not any analytics product’s market share or effectiveness. [10]
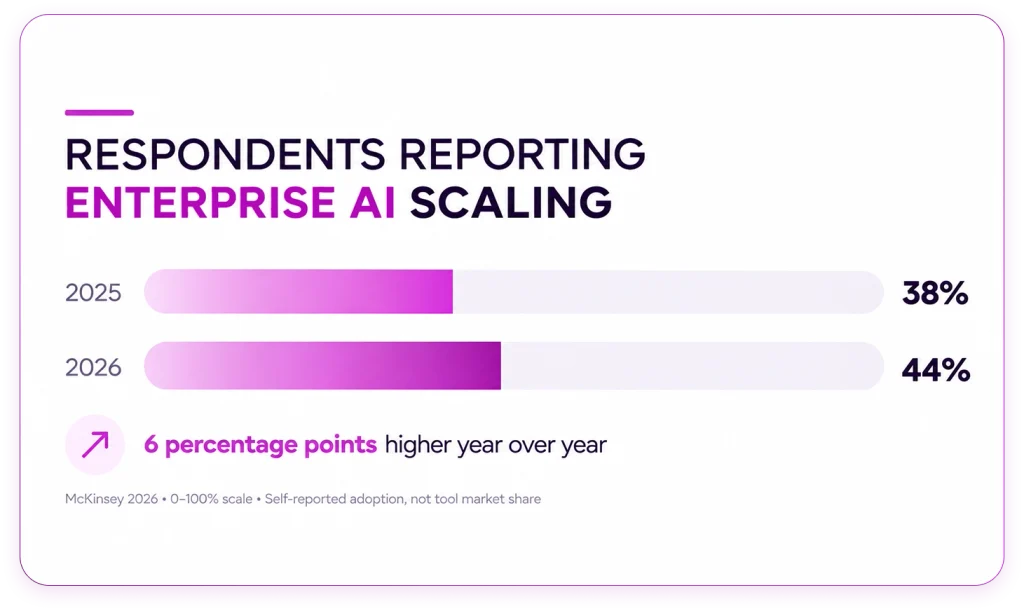
    The practical takeaway for buyers is that AI capability alone is not enough. Teams need to understand whether AI can work inside their definitions, permissions, workflows, and review standards.

    Context is becoming a buying criterion

    A major analytics challenge is getting AI systems to understand business context.

    Alteryx’s August 2026 study reports that 53 percent of surveyed organizations struggle to translate business context into AI workflows. The vendor-sponsored research was based on a Coleman Parkes survey of 1,400 technology leaders. [11]

    For analytics buyers, the practical implication is clear: demos should test more than the interface.

    They should test:

    metric definitions

    exceptions

    access rules

    source visibility

    permission handling

    what happens when the system does not have enough information

    A clean demo is useful. A workflow test is better.

    Research is moving beyond isolated queries

    Analytics evaluation is also moving beyond simple question-and-answer tests.

    The September 2026 BI-Agent and BI-Bench preprint evaluates tasks such as finding tables, transformations, and joins. The authors report below-50 percent accuracy for the frontier LLMs tested, improving with their specialized approach. The benchmark does not compare the six tools in this guide; it supports testing complete workflows. [12]

    That matters because a tool may answer a clean prompt in a demo.

    The real test is whether it can handle the path from question to source, transformation, calculation, validation, and review.

    Product changes can make tutorials outdated

    Analytics products are changing quickly.

    Microsoft retired Excel’s preview COPILOT function on September 14, 2026, while the Copilot pane remains. Power BI and Tableau also offer conversational assistance within established BI environments. [4, 5, 13]

    The lesson is simple: check current product availability before relying on a tutorial, demo, or old implementation note.

    Product packaging, eligibility, licensing, and supported features can change. The evaluation should be based on the current environment your team will actually use.

    Compare workflows with one real business question

    The best way to evaluate analytics tools is to test one real business question across workflows.

    Some follow-up questions need new modeling or specialist work. Others can be answered with already-approved data and definitions. Both paths are valid, but they should be measured against the same standards.
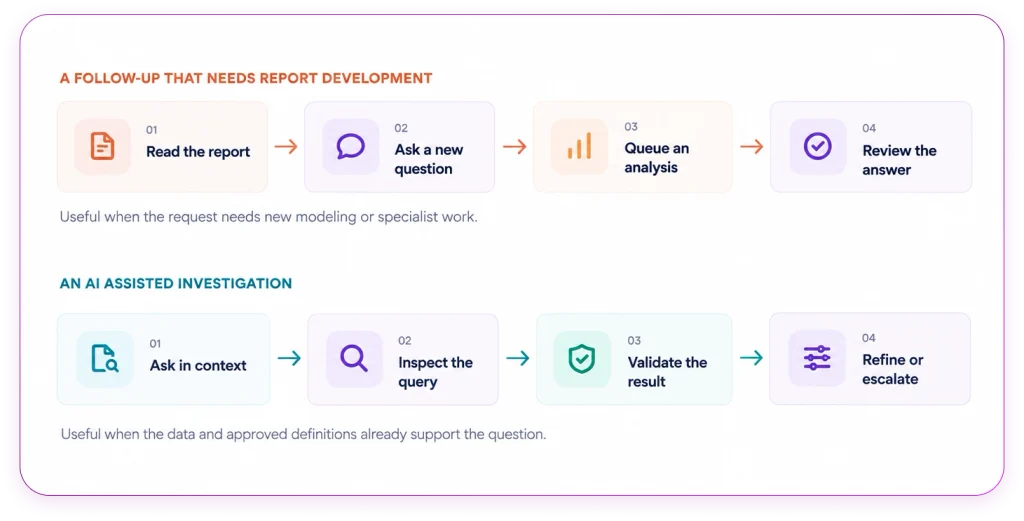
    Figure 3. Two illustrative follow-up paths. Both can exist in the same platform; this is not a timing benchmark.

    Now try a simple test.

    These fictional campaigns use the same period:
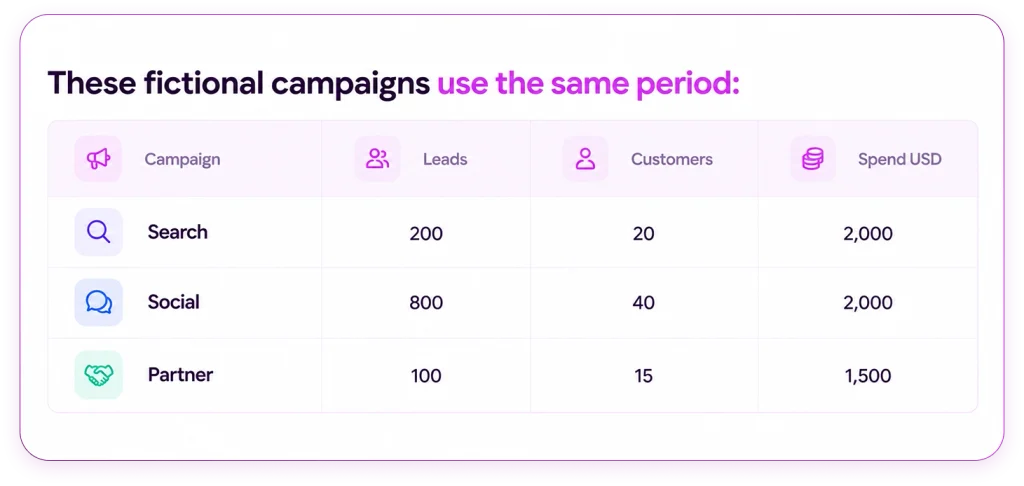
    Ask your chosen tool:

    “Calculate customer conversion rate and cost per customer by campaign. Show the formulas. Then calculate the combined conversion rate. Explain whether these numbers alone justify a budget change.”

    Before calculating, predict which campaign has the highest lead-to-customer conversion rate.

    Then test the follow-up:

    “What if customer counts include duplicates across campaigns?”

    A useful response should request the relevant identifiers or explain the limitation. It should not silently treat those customer counts as unique people if that has not been established.

    Record:

    correctness

    time to a checked result

    analyst help required

    repeatability

    whether the tool explains limitations

    whether it can be tested with fresh data

    whether it respects a restricted user’s permissions

    Check the result, then check the workflow

    The combined conversion rate is 75 customers divided by 1,100 leads, or 6.82 percent, assuming consistent counting rules. Averaging the three campaign percentages gives the wrong combined rate.

    This small example shows why analytics evaluation should go beyond whether the tool returns a number.

    Partner has the highest conversion rate. Social has the lowest cost per customer. Neither finding establishes profitability or proves that the budget should change. A real decision would need more evidence, including customer value, attribution, and duplicate handling.

    What to measure in the evaluation

    When testing any analytics workflow, separate the measures.

    Look at:

    whether the result was correct

    how long it took to reach a checked result

    how much analyst help was needed

    whether the result could be repeated

    whether definitions were clear

    whether permissions were respected

    whether the source could be inspected

    whether the tool explained limitations instead of guessing

    Then repeat the test with fresh data and a restricted user.

    That final step matters. A workflow that works for an admin user may fail when access rules, incomplete data, or ambiguous terms are introduced.

    Choose the workflow your team can trust and repeat

    The best analytics tool is not always the most advanced one.

    It is the one that fits the question, the user, the data, and the review standard.

    Use Excel when the work belongs in a workbook and the logic needs to be inspected. Use SQL when you need to examine structured data behind the result. Use Python with pandas when the work requires repeatable preparation and custom analysis. Use Power BI or Tableau when the team needs shared reporting and visual analysis.

    Evaluate QuaerisAI when business users need governed questions across enterprise data with definitions, permissions, and source traceability in the workflow.

    To evaluate QuaerisAI, bring a real question, the definition behind it, and a reference result. Ask for a checked result, then change the question and permissions. Judge the workflow by what it improves. [2]

    That is the clearest way to compare analytics tools in 2026: start with the work, test the workflow, and choose the tool your team can trust enough to repeat.

  • Self-Service Analytics for Retail

    Self-Service Analytics for Retail

    TL;DR

    Retail self-service analytics should be measured by whether users reach usable answers with less rework, not by dashboard volume alone. PAYBACK’s example shows why shared definitions, access controls, source evidence, and a clear escalation path matter when campaign teams need to move from report to decision.

    From Coupon Counts to Answers That Drive Decisions

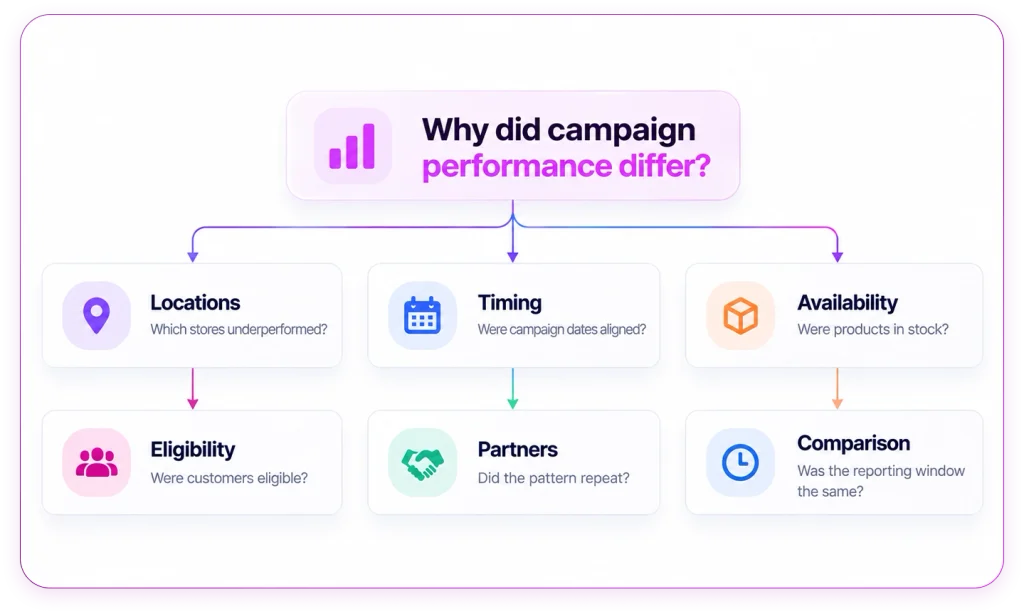
    A loyalty manager can already see total coupon redemptions, but the real question is why certain stores underperformed. Was it a stock issue? A timing issue? A customer eligibility issue? Or did the campaign simply fail to drive the expected behavior? 

    Answering that follow-up usually means another report request. 

    By the time the answer arrives, the next promotion may already be underway. 

    That is the practical problem self-service analytics is supposed to solve. The value is not just giving users another dashboard. It is helping business teams investigate approved data, ask the next question, and move toward a decision without waiting for every variation to become a specialist request. 

    PAYBACK’s experience offers a useful example for retail marketing, loyalty, and analytics leaders thinking about what effective self-service should look like. 

    What PAYBACK Changed 

    According to ThoughtSpot’s PAYBACK customer story, PAYBACK’s earlier reporting environment required technical intervention even for small adjustments. Reporting backlogs delayed answers, and users relied on email and spreadsheets to get the views they needed. 

    With ThoughtSpot, employees could explore coupon performance at individual stores on specific days in near real time. The story also describes independent performance monitoring across retail partners and more time for analysts to focus on strategic work. 

    PAYBACK’s reported self-service footprint included: 

    • 70+ major retail partners 
    • 300+ user-created Liveboards 
    • 150 standard reports 

    These figures are useful as adoption indicators, but they should not be read as active-user rates, answer accuracy measures, or financial return. They show scale and content creation, not the full quality of decision-making. 

    That distinction matters. 

    Self-service analytics should not be evaluated only by the number of dashboards or reports created. A better question is whether users can reach usable answers with less rework, while still relying on shared definitions, appropriate access, and evidence they can inspect. 

    The Real Test Is the Follow-Up Question 

    Retail teams rarely stop at the first answer. 

    A campaign dashboard may show that one store group had lower coupon redemptions. But the next questions come quickly: 

    Which locations underperformed? 

    Were campaign dates aligned? 

    Were the products available? 

    Were customers eligible? 

    Did the same pattern appear across partners? 

    Was the comparison based on the same reporting window? 

    Before interpreting the result, the team also needs to agree on the measure itself. “Redemption rate” can mean different things depending on the denominator. It could be issued coupons, activated offers, or eligible customers. 

    If those definitions are unclear, self-service can spread confusion faster than traditional reporting ever did. 

    This is where retail analytics needs more than access. It needs a workflow that helps users understand what they are asking, what data is being used, and whether the answer is reliable enough to support action. 

    Why Self-Service Still Needs Guardrails 

    Self-service analytics does not remove the need for analysts, definitions, or governance. It changes where those controls need to show up. 

    A business user should be able to explore approved data without opening a ticket for every follow-up. But that exploration still needs boundaries. 

    The system should help users confirm: 

    • which metric definition is being used 
    • which dates and stores are included 
    • which source data supports the answer 
    • whether the user has access to the right scope 
    • when the question needs analyst review 

    For example, a stock shortage may call for an operational fix. A question about whether a promotion drove incremental sales may require a comparison group and deeper analyst support. Higher redemptions alone do not prove incremental revenue. 

    A useful self-service workflow should make that distinction clear. 

    A Better Way to Pilot Self-Service Analytics 

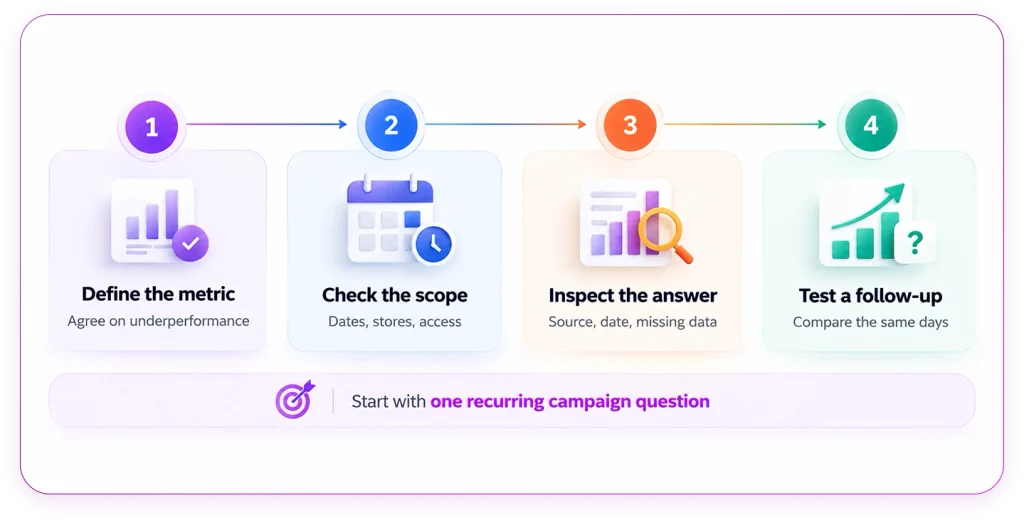
    For retail teams evaluating self-service analytics, the best pilot does not start with a broad rollout. It starts with one recurring campaign question that already creates reporting friction. 

    For example: 

    Which stores underperformed during our latest coupon campaign? 

    From there, the team can test the workflow end to end. 

    Figure 2  A pilot that follows the question through to review. 

    Start by defining the metric. Confirm what “underperformance” means and how the calculation is handled. 

    Next, check the scope. Confirm campaign dates, eligible customers, participating stores, and user permissions. 

    Then inspect the answer. Review the source, metric definition, reporting date, and any missing information. 

    Finally, test a follow-up that changes the decision. For example: 

    Does the difference remain when we compare the same campaign days? 

    This kind of pilot is more useful than a polished demo because it shows whether the system can support a real business investigation. 

    Measure Useful Independence 

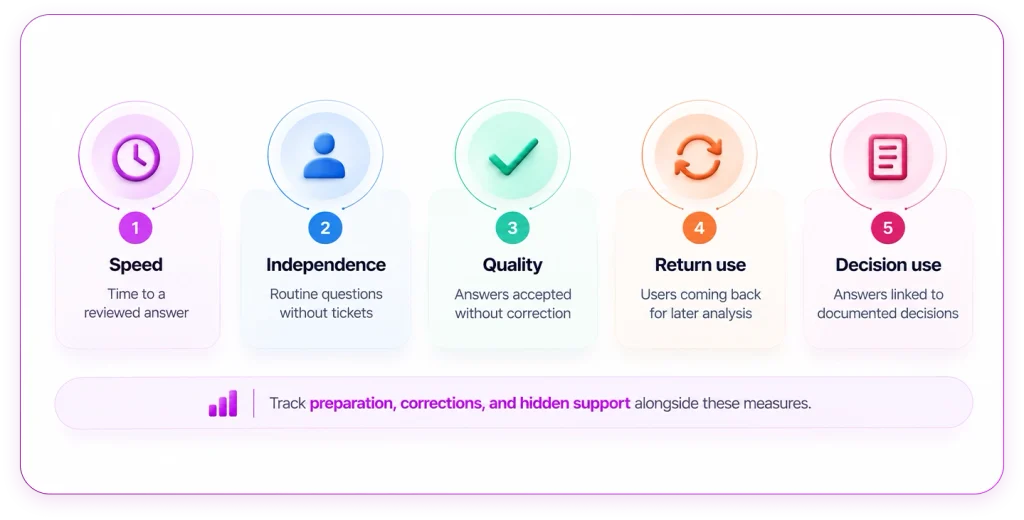
    A strong self-service pilot should not only ask whether users can create more views. It should measure whether users reach better answers with less rework. 

    Before the pilot begins, teams should agree on success criteria. 

    Useful measures include: 

    • time from question to reviewed answer 
    • routine questions resolved without a specialist ticket 
    • answers accepted without correction 
    • users returning for later analysis 
    • answers linked to a documented business decision 

    This creates a more practical basis for expansion than dashboard count alone. 

    It also keeps teams honest. A shorter reporting queue is only useful if the work has not simply moved elsewhere, into more preparation, more corrections, or more hidden support from analysts. 

    Where QuaerisAI Fits 

    QuaerisAI helps teams connect business questions to definitions, source traceability, and access controls. 

    For retail and CPG teams, that can support use cases across merchandising, inventory, demand, and trade-promotion analysis. The useful test is not whether the platform can answer a polished demo question. The useful test is whether it can support the way campaign teams actually investigate performance across the systems they already use. 

    A QuaerisAI demo should make the answer inspectable. 

    For a question like “Which stores underperformed during our latest coupon campaign?”, the review should show: 

    • how underperformance is defined 
    • which source data supports the answer 
    • which dates and stores are included 
    • what scope the user is allowed to see 
    • whether the evidence is strong enough to act on 
    • when a follow-up requires analyst review 

    That is the difference between self-service as dashboard access and self-service as a decision workflow. 

    Give the Next Question a Clear Path 

    Retail analytics does not fail because teams lack dashboards. It often fails because the next question has nowhere clean to go. 

    Self-service works when users can continue a useful investigation, understand the answer, and recognize when specialist help is needed. 

    Start with one campaign question that repeatedly returns to the reporting queue. Define what a trustworthy answer requires. Then test the workflow against it. 

    Bring one recurring campaign question to a QuaerisAI demo. Review the metric definition, source data, access scope, and follow-up workflow behind the answer. 

  • QuaerisAI Now Connects to ClickHouse

    QuaerisAI Now Connects to ClickHouse

    Real-time data is becoming central to how modern teams operate. Marketing teams need to understand campaign movement. Finance teams need to review usage and metering data. Risk and operations teams need to investigate unusual activity. Product teams want to bring analytics closer to customers. 

    ClickHouse gives teams a high-performance foundation for querying large volumes of fast-moving data. 

    QuaerisAI adds the governed question layer on top. 

    With the ClickHouse integration, business users can ask questions in plain English and receive answers that stay connected to certified definitions, source data, and governance controls. The goal is to make real-time data easier to access, explain, and trust across the business. 

    For many organizations, the challenge is not that the data does not exist. The challenge is that access to that data often depends on SQL, dashboards, or data team support. 

    A marketer may want to know which campaigns underperformed this week. A finance user may need to review usage data behind billing. A risk team may want to investigate unusual patterns. An executive may need a current answer for a board discussion. 

    These questions should not always require a new dashboard or a manual reporting request. 

    QuaerisAI helps close that gap by translating plain-English questions into governed queries that run against ClickHouse. Answers are mapped through QuaerisAI’s semantic layer, so teams can work from consistent definitions instead of recreating metric logic for every request. 

    That governance layer matters. 

    Natural-language analytics can make data easier to access, but enterprise teams also need control over how answers are produced. Metrics need to be defined consistently. Answers need to remain traceable to source. Business users need confidence that the number they are using has the right context behind it. 

    The QuaerisAI and ClickHouse integration is designed for teams that need both speed and trust. 

    ClickHouse supports the real-time analytics layer for high-volume data. QuaerisAI helps business users ask questions, understand answers, and trace results back to certified definitions and source data. 

    This combination can support use cases across real-time marketing analytics, usage-based pricing and metering, anomaly investigation, embedded customer-facing analytics, and executive reporting. 

    For ClickHouse customers, QuaerisAI expands the way real-time data can be used across the business. More teams can ask questions directly. Data teams can reduce repetitive reporting requests. Business users can move from raw event data to governed answers with less friction. 

    Real-time analytics becomes more useful when it is accessible to the teams making decisions every day. 

    With QuaerisAI on top of ClickHouse, fast-moving data can become trusted business answers. 

  • Five reasons “AI BI” without governance fails in regulated industries

    Five reasons “AI BI” without governance fails in regulated industries

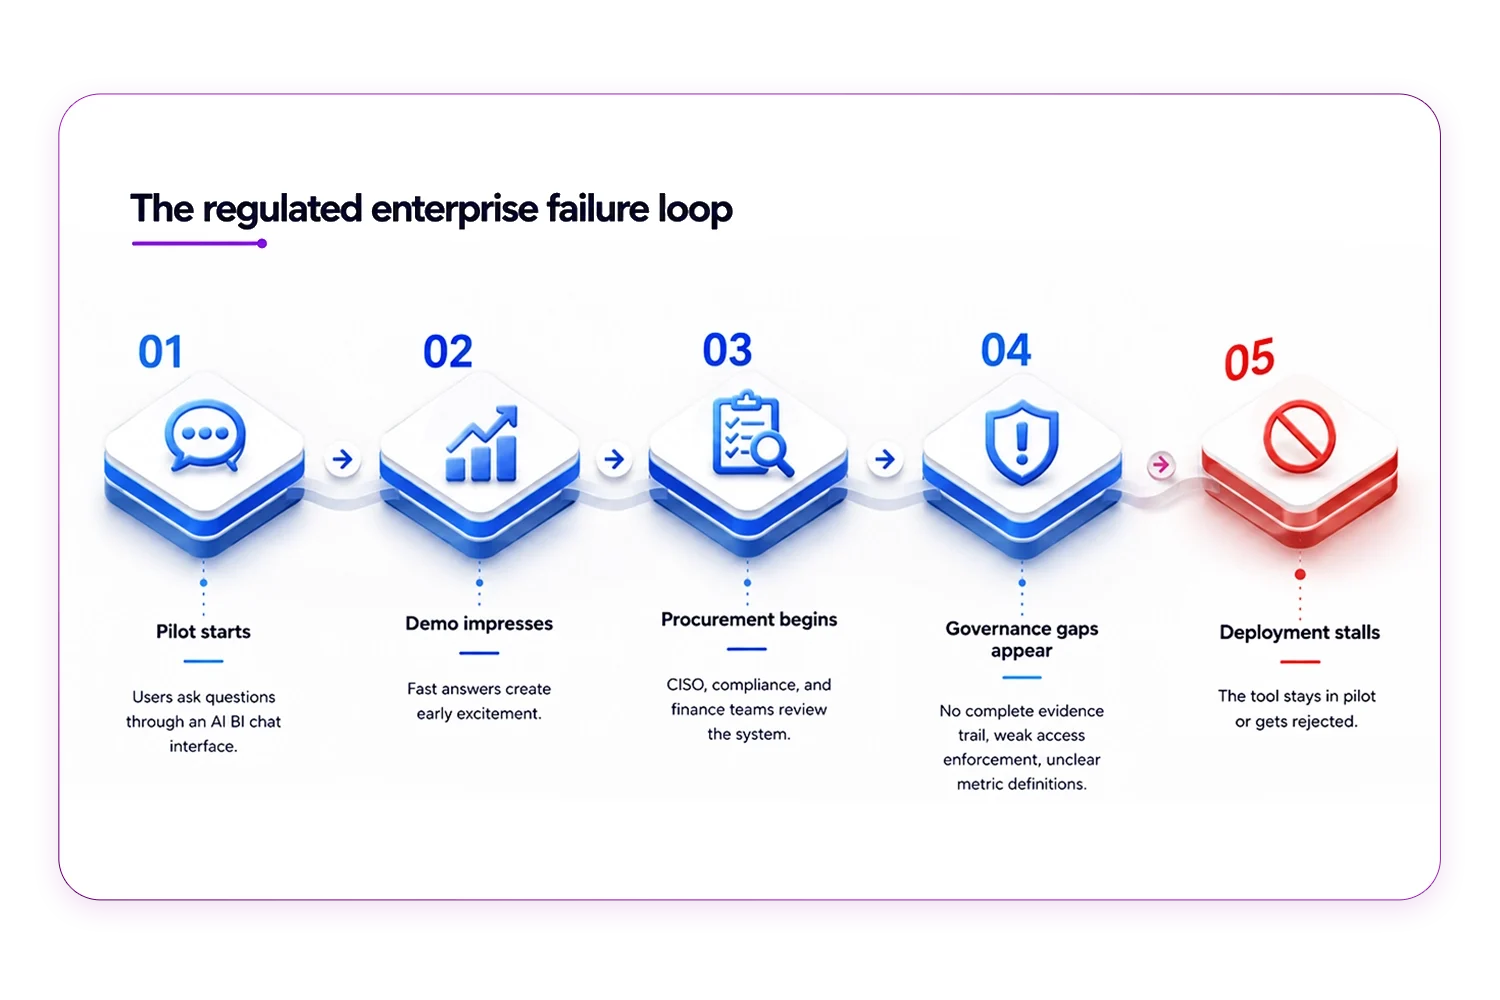
    Regulated enterprises do not get to fail quietly. When a bank, an insurer, or a health system deploys analytics software that produces an indefensible number, the consequence is not an internal retrospective. It is an audit finding, a regulatory inquiry, or a remediation programme with a budget line. This is why the wave of “AI BI” tools, chat interfaces bolted onto warehouses with a capable model underneath, keeps stalling at exactly the same stage in regulated industries: the pilot impresses, the procurement review begins, and the deployment dies. The failure is not the model. It is the absence of governance, and it fails in five specific ways.

    Reason one: answers that cannot be evidenced are answers that cannot be used

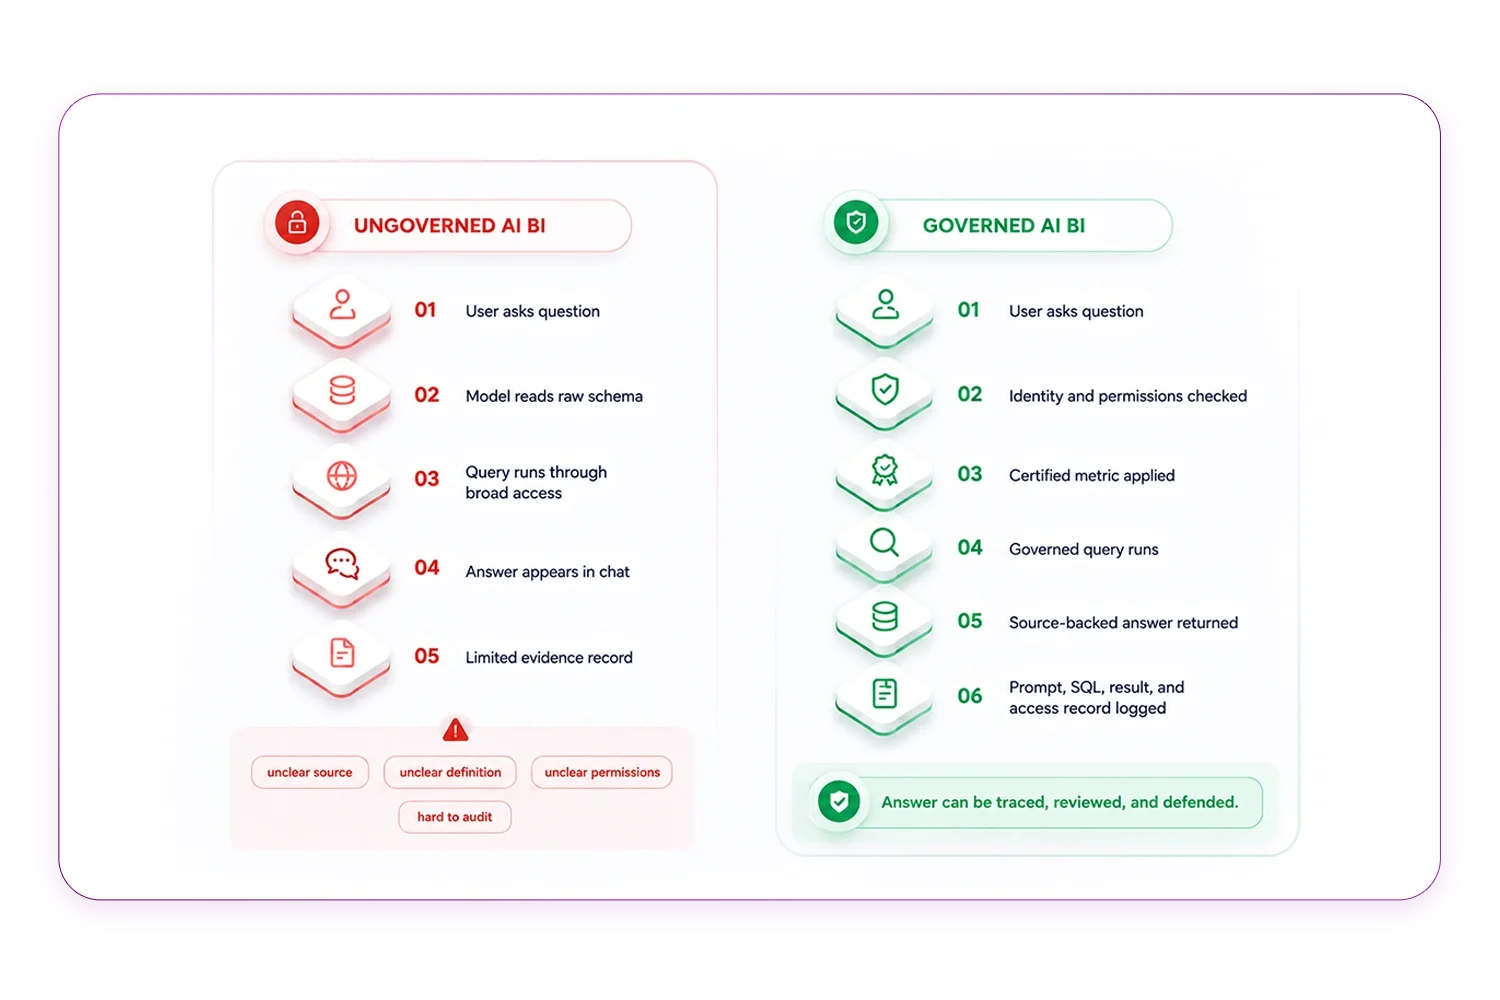
    Regulated industries run on evidence. A number that reaches a regulator, an external auditor, or a filing must be supportable with documentation of its origin. An ungoverned AI BI tool produces answers in a chat window and retains, at best, a conversation history. There is no linked record of who asked, what SQL ran, which tables were read, or which definitions were applied. The tool’s answers may be perfectly correct, but correctness without evidence has no standing in a regulated process. The output is unusable for exactly the decisions that matter most, which confines the tool to trivia and guarantees it never justifies its cost.

    Reason two: uncontrolled definitions produce contradictory numbers in official places

    A model reading a raw schema must guess what the business means by its own vocabulary. Which of several revenue columns is the certified one? Are written premiums gross or net of reinsurance here? Does this health system count readmissions within 30 days or 90? An ungoverned tool answers these questions differently depending on phrasing, context, and chance. In an unregulated setting, that produces confusion. In a regulated one, it produces two different figures for the same metric in two official documents, and reconciling contradictory reported numbers is a process no compliance team enjoys. Without a certified semantic layer, this outcome is not a risk. It is a schedule.

    Reason three: access control that lives outside the query path is access control in name only

    Regulated data carries entitlement rules with legal force: patient records under health privacy law, material non-public information inside financial institutions, policyholder data under insurance regulation. Many AI BI tools connect to the warehouse through a single service account with broad read access, then rely on the application layer to decide what users should see. The moment the model generates an unanticipated query, that arrangement leaks. Governance means the agent inherits the asker’s permissions and enforces them at query time, so the question a user is not entitled to ask returns nothing, structurally, rather than being filtered by hope. Regulators examine the structural version. They penalise the other one.

    Reason four: hallucinated analysis is fluent, and fluency defeats casual review

    The dangerous failure mode of an ungoverned tool is not the visibly wrong answer. It is the plausible one: a well-formed figure, confidently presented, resting on a silently invented join or a misread column. Human review catches this only when the reviewer independently reproduces the work, which eliminates the time savings that justified the tool. Governed platforms attack this differently: grounding generation in certified definitions so there is less room to invent, and attaching the generated SQL and sources to every answer so verification takes minutes instead of hours. In a regulated industry, where an incorrect figure can constitute a reporting breach rather than an embarrassment, this difference is the whole game.

    Reason five: the veto holders were never going to approve it

    Enterprise AI deployments in regulated industries pass through three offices that each hold a veto: the CISO, the head of compliance, and increasingly the CFO. Each asks a governance question. The CISO asks how access is enforced and where data travels, including whether it leaves for a model vendor the organisation has not approved. Compliance asks how the system’s decisions will be documented for examiners. The CFO asks how a number can be traced when challenged. An ungoverned tool has no answer for any of the three, which means the deployment fails in procurement no matter how well the pilot went. The pattern repeats so reliably that it should be treated as a law of the category: in regulated industries, governance is not a feature of the deployment. It is the precondition for there being a deployment at all.

    The conclusion regulated buyers are reaching

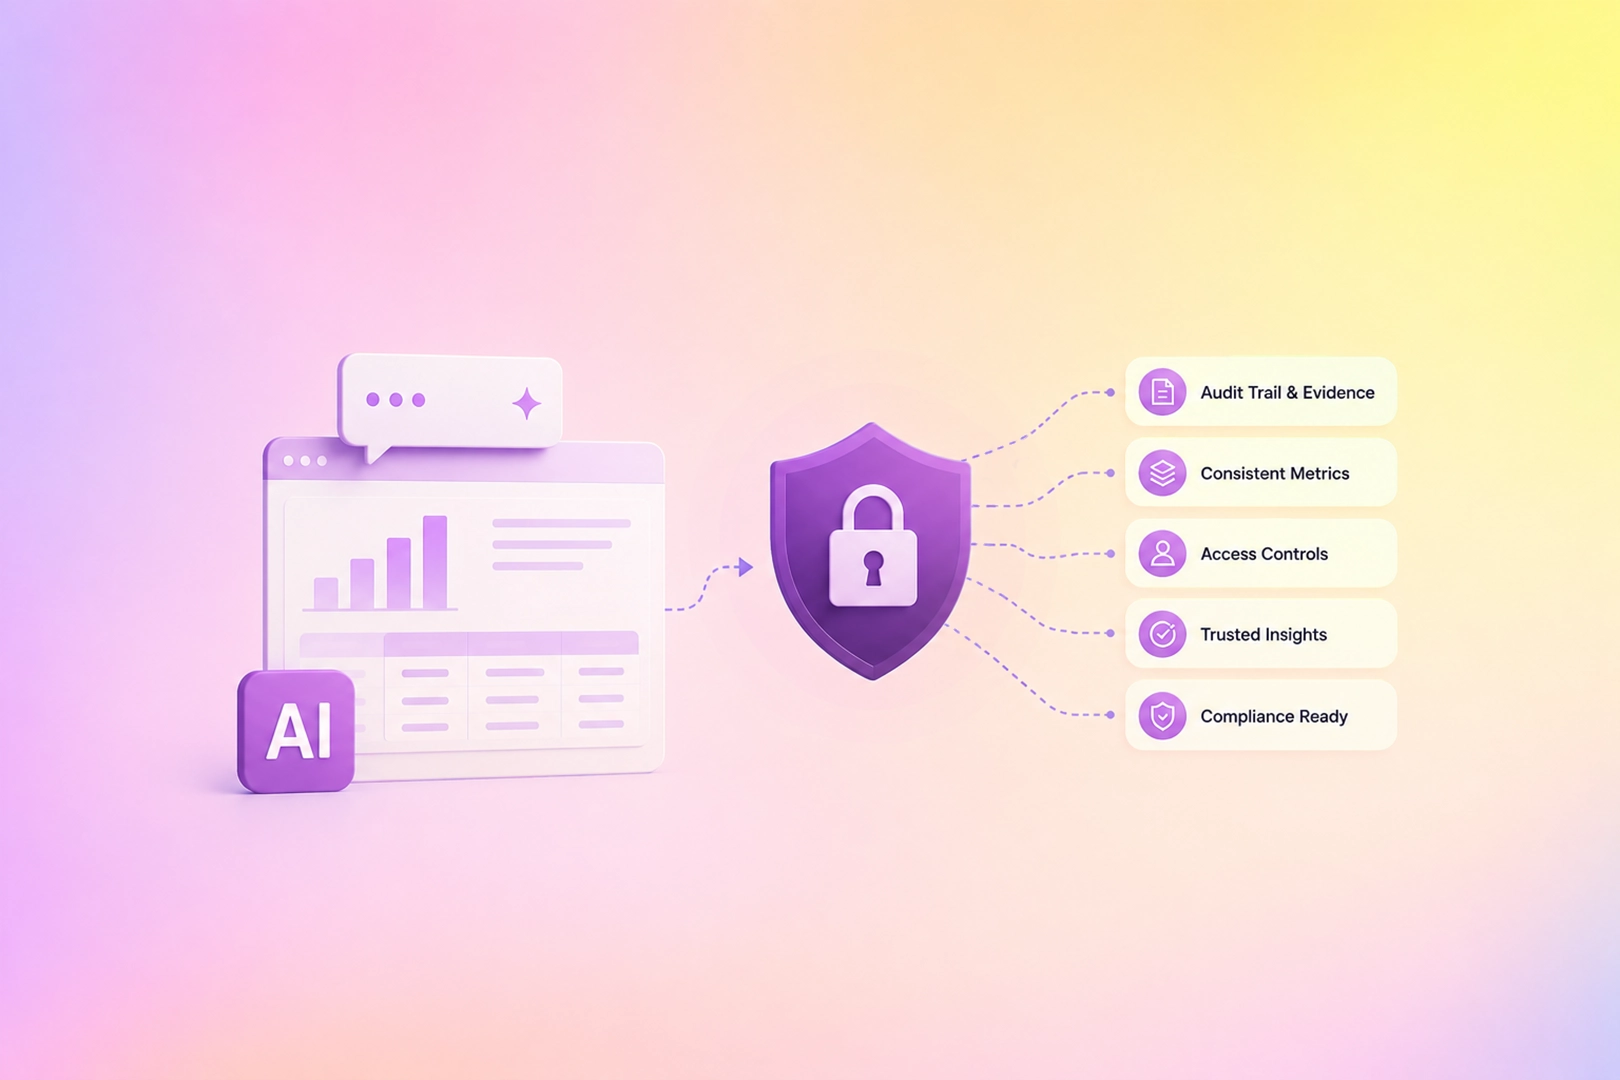
    None of these five failures is cured by a better model, because none of them is a capability problem. They are control problems, and controls have to be architectural: a certified semantic layer, permissions enforced at query time, a complete prompt-level audit trail, and model choice the enterprise can direct. Platforms built this way clear the vetoes that kill their ungoverned rivals, and the results follow deployment rather than remaining in pilots. Based on QuaerisAI customer deployments and published materials, governed deployments have achieved BI adoption rates of 30 to 60 percent and reductions in BI cost of 70 percent, outcomes that are only available to tools that regulated enterprises are actually permitted to use.

    Frequently asked questions

    What counts as “AI BI without governance”?

    Any deployment where a language model generates analysis against enterprise data without three controls in place: certified metric definitions the model must use, user-level access permissions enforced when the query executes, and a complete linked record of each interaction from prompt to SQL to result. A tool can be highly capable and still be ungoverned. The two properties are independent.

    Are regulated industries simply late adopters of AI analytics?

    No. They are early adopters of governed AI analytics and non-adopters of ungoverned AI analytics. The demand for faster answers is at least as strong in banking, insurance, and healthcare as anywhere else. What differs is that these industries cannot absorb the failure modes of ungoverned tools, so they wait for platforms where the controls are structural.

    Can governance be added to an existing AI BI deployment later?

    Partially, and expensively. Access enforcement and audit trails must live inside the query pipeline to be complete, which usually means the platform has to be built for them. Retrofitting typically produces fragmented logs and application-layer filtering, which are exactly the versions that fail examination. The practical answer is to evaluate for governance at selection, not remediation.

  • How to choose new age AI BI (and what to actually evaluate)

    How to choose new age AI BI (and what to actually evaluate)

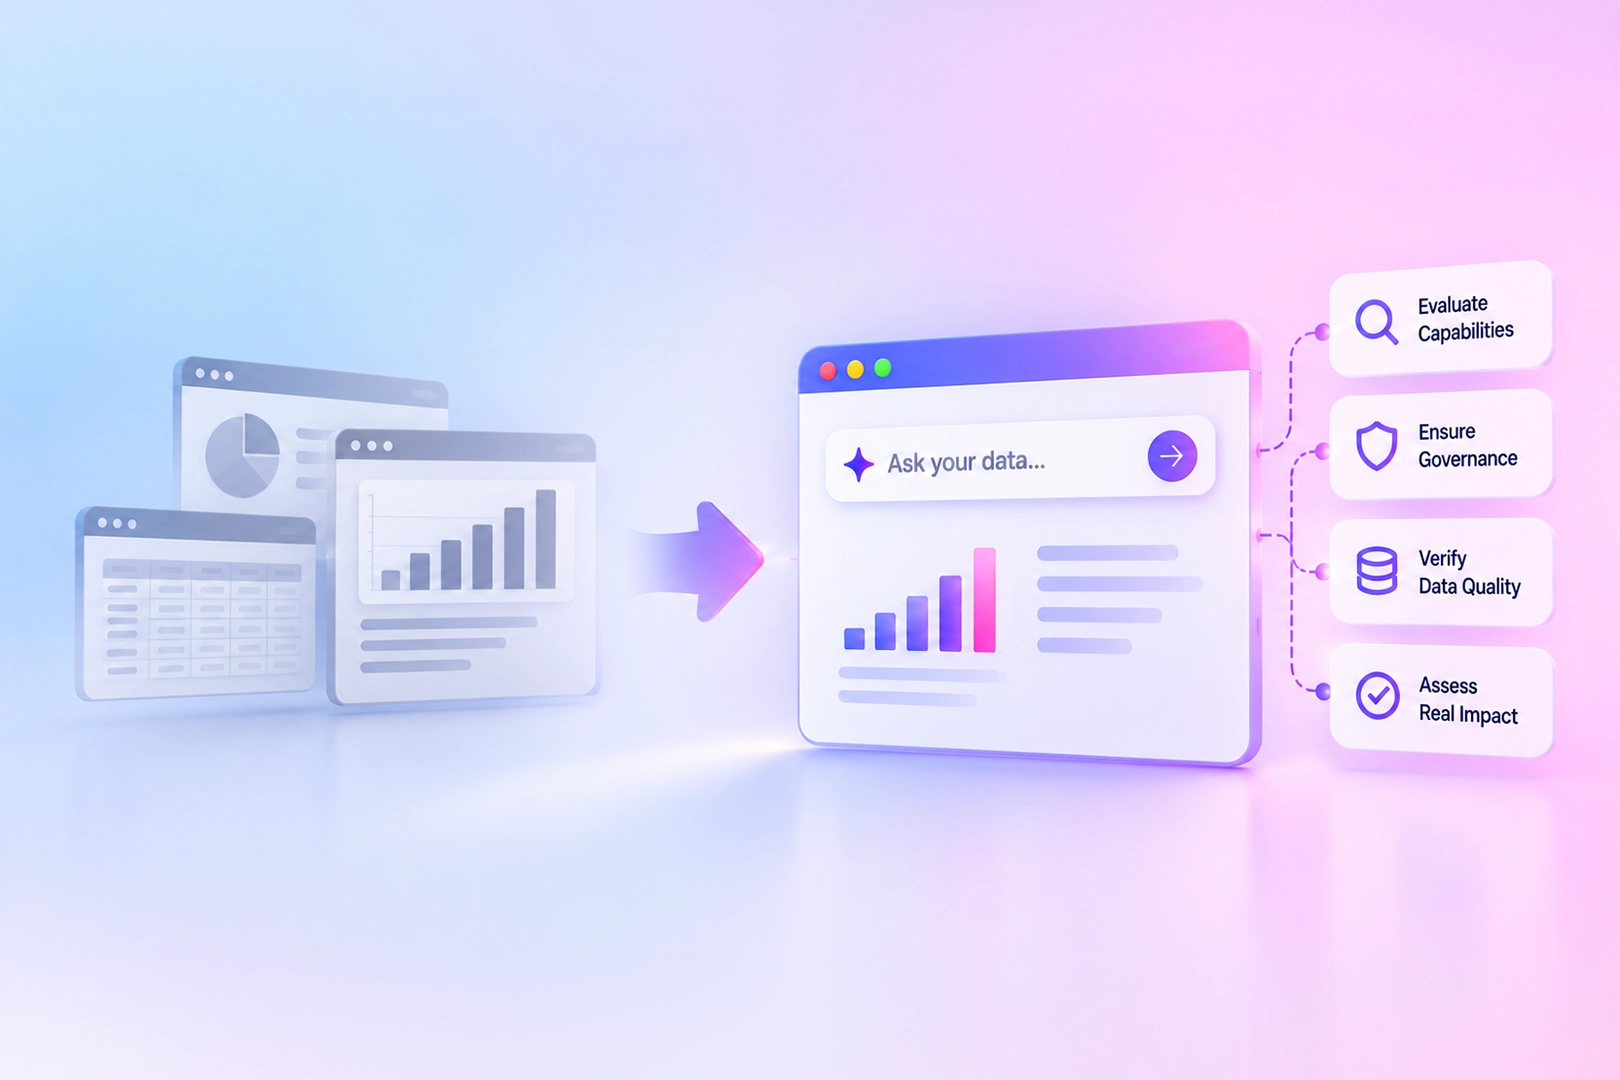
    Every AI BI vendor’s homepage says roughly the same four things. Ask questions in plain English. Get instant answers. No more waiting on analysts. Works with any data source. Read ten of these homepages back to back and they start to blur into one page with a different logo at the top.

    None of that tells you which one will actually hold up once real business users start asking it real questions. The differences that matter are almost never visible in a demo. They show up three months in, when someone asks a question the demo never covered, or when two people ask the same question and get two different answers, or when someone in compliance asks how a specific number was produced and nobody can say for certain.

    Here is what actually separates these tools, past the homepage.

    Old BI evaluation criteria don’t fully apply anymore

    Traditional BI evaluations focused on things like dashboard build speed, visualization variety, and how many connectors a tool shipped with. Those questions still matter, but they’re no longer sufficient. A tool that answers questions conversationally introduces a new category of risk that dashboard-based BI never had: the tool can now generate a wrong answer that looks exactly as confident as a right one.

    A static dashboard can be misread, but it can’t lie to you in a full sentence. A conversational AI layer can. That changes what “evaluation” needs to cover.

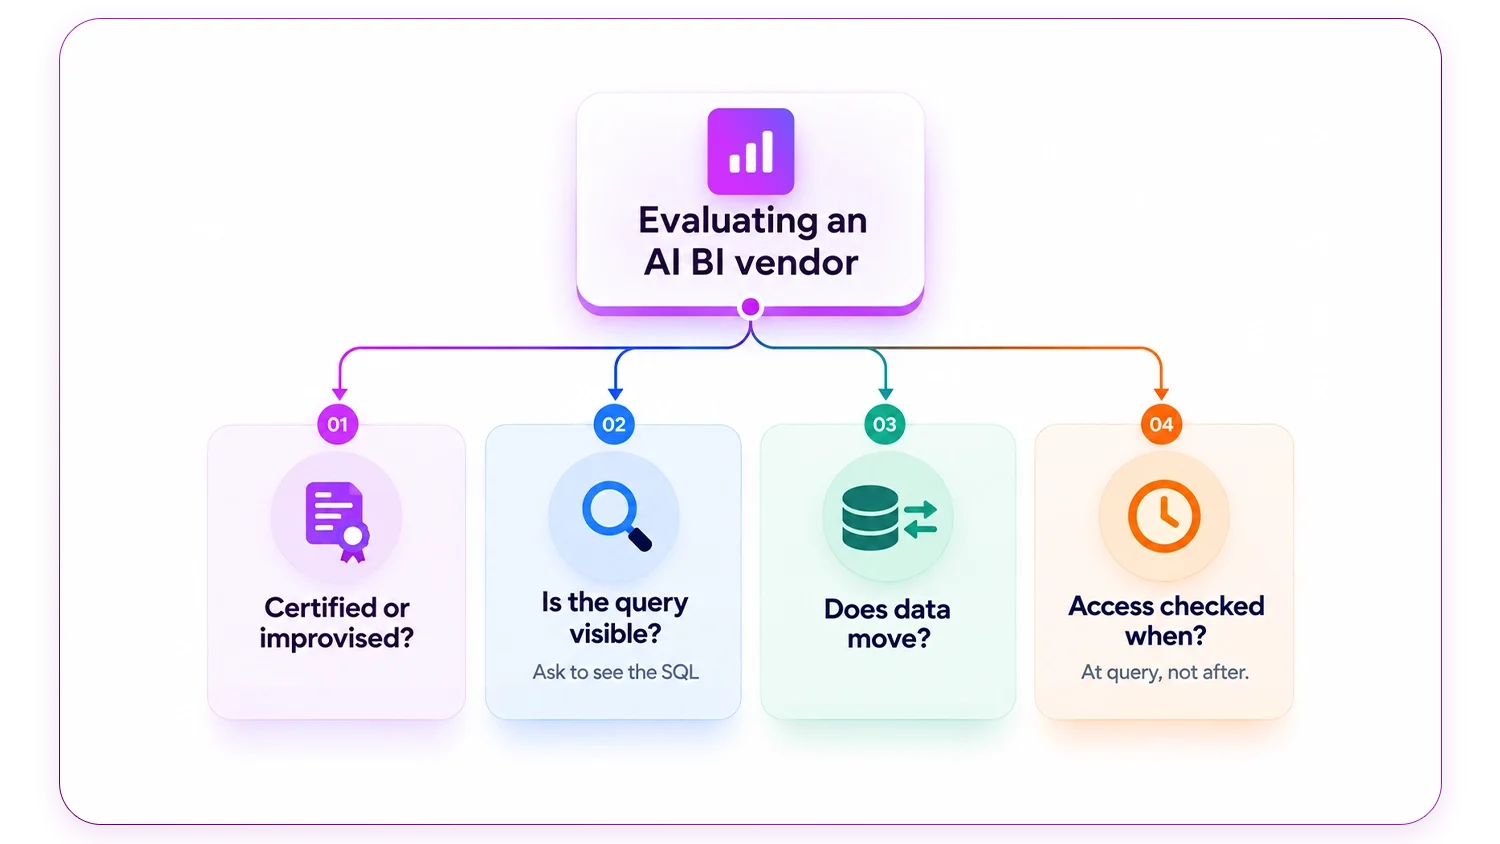
    Does it answer from certified definitions, or improvise them?

    This is the single most important question, and it’s the one most demos are built to avoid. Ask the vendor directly: when someone asks about a metric that has no formal definition yet, what happens? A tool built around a governed semantic layer will say it can’t answer until that metric is defined, or it will show you exactly which definition it used and let you inspect it. A tool built primarily on a language model’s general reasoning will often generate something plausible anyway, calculated on the fly from whatever it can infer, without telling you that’s what happened.

    The second version demos beautifully. It also means two people can ask the identical question a week apart and get two different numbers, because the model quietly re-derived the logic each time.

    Can you see the query behind the answer?

    Ask for the actual SQL, or whatever query the system generated to produce the answer. Not a summary of the logic, the literal query. If a vendor can’t show you that, or treats it as a power-user feature buried three menus deep, that’s worth noting. The ability to inspect the underlying query is what turns “trust the AI” into “verify the AI,” and only one of those scales past the first few months of skepticism from an audit or finance team.

    Does data have to move to get an answer?

    Some AI BI tools require pulling your data into their own environment before they can answer anything, a separate copy, a separate pipeline, a new place for that data to live and go stale. Others query your existing warehouse directly, in place, read-only. The difference matters more than it sounds like in a demo, because every extra copy of your data is a new thing to secure, govern, and eventually reconcile against the original.

    Ask specifically whether the tool executes against your warehouse or requires ingestion into its own store first. The answer changes your total security surface, not just your architecture diagram.

    What happens when it doesn’t know?

    Every AI BI tool will eventually be asked something it can’t answer well, a metric that doesn’t exist, a question outside its scope, ambiguous phrasing. What it does at that moment tells you more than almost anything else in the evaluation. Some tools guess anyway and present the guess with full confidence. Others say plainly that the definition doesn’t exist yet, or that the question needs to be narrowed. Push on this specifically during any trial. Ask something you know the tool cannot answer correctly and watch what it does instead of admitting the gap.

    Who can ask what?

    Self-service only works if access is actually scoped. Ask how permissions are enforced: is access checked at the moment a query runs, or is it enforced by filtering results after the fact, or worse, left to the model to respect on its own. Query-time enforcement means a user literally cannot retrieve data outside their permission, regardless of how the question is phrased. Post-hoc filtering or model-level trust means the boundary is softer than it looks, and softer boundaries tend to fail exactly when someone gets creative with a prompt.

    Can you choose your own model, or are you locked to one?

    The underlying language model powering these tools changes fast, and today’s best option won’t stay the best option indefinitely. A tool tightly coupled to one specific model ties your governance and your model choice together permanently. A tool that separates the semantic layer from the model itself lets you change models as the market moves without rebuilding your certified definitions from scratch.

    The red flags that sound good in a demo

    A few things worth specific suspicion, because they tend to demo well and hold up poorly: a tool that never says “I don’t know,” a tool where every answer looks equally confident regardless of how well-supported it actually is, a tool that can’t show you its own reasoning path when asked directly, and a tool where the sales team can’t clearly explain what happens to a question outside its trained scope.

    None of these are dealbreakers on their own. All of them together usually mean the tool was built to impress in a thirty-minute demo, not to survive daily use by people who will eventually ask it something it wasn’t ready for.

    What actually matters

    The vendors selling AI BI are not lying when they say it’s faster than a dashboard. It usually is. The real evaluation question isn’t speed, every tool in this category is fast now. It’s whether the speed is coming from a governed, certified answer or from a model’s best guess dressed up to look certain. One of those scales safely as more people start relying on it. The other one accumulates risk quietly, one plausible-sounding answer at a time, until someone finally asks where a number came from and nobody can say.

  • Why your CFO will ask about AI lineage before they ask about AI accuracy

    Why your CFO will ask about AI lineage before they ask about AI accuracy

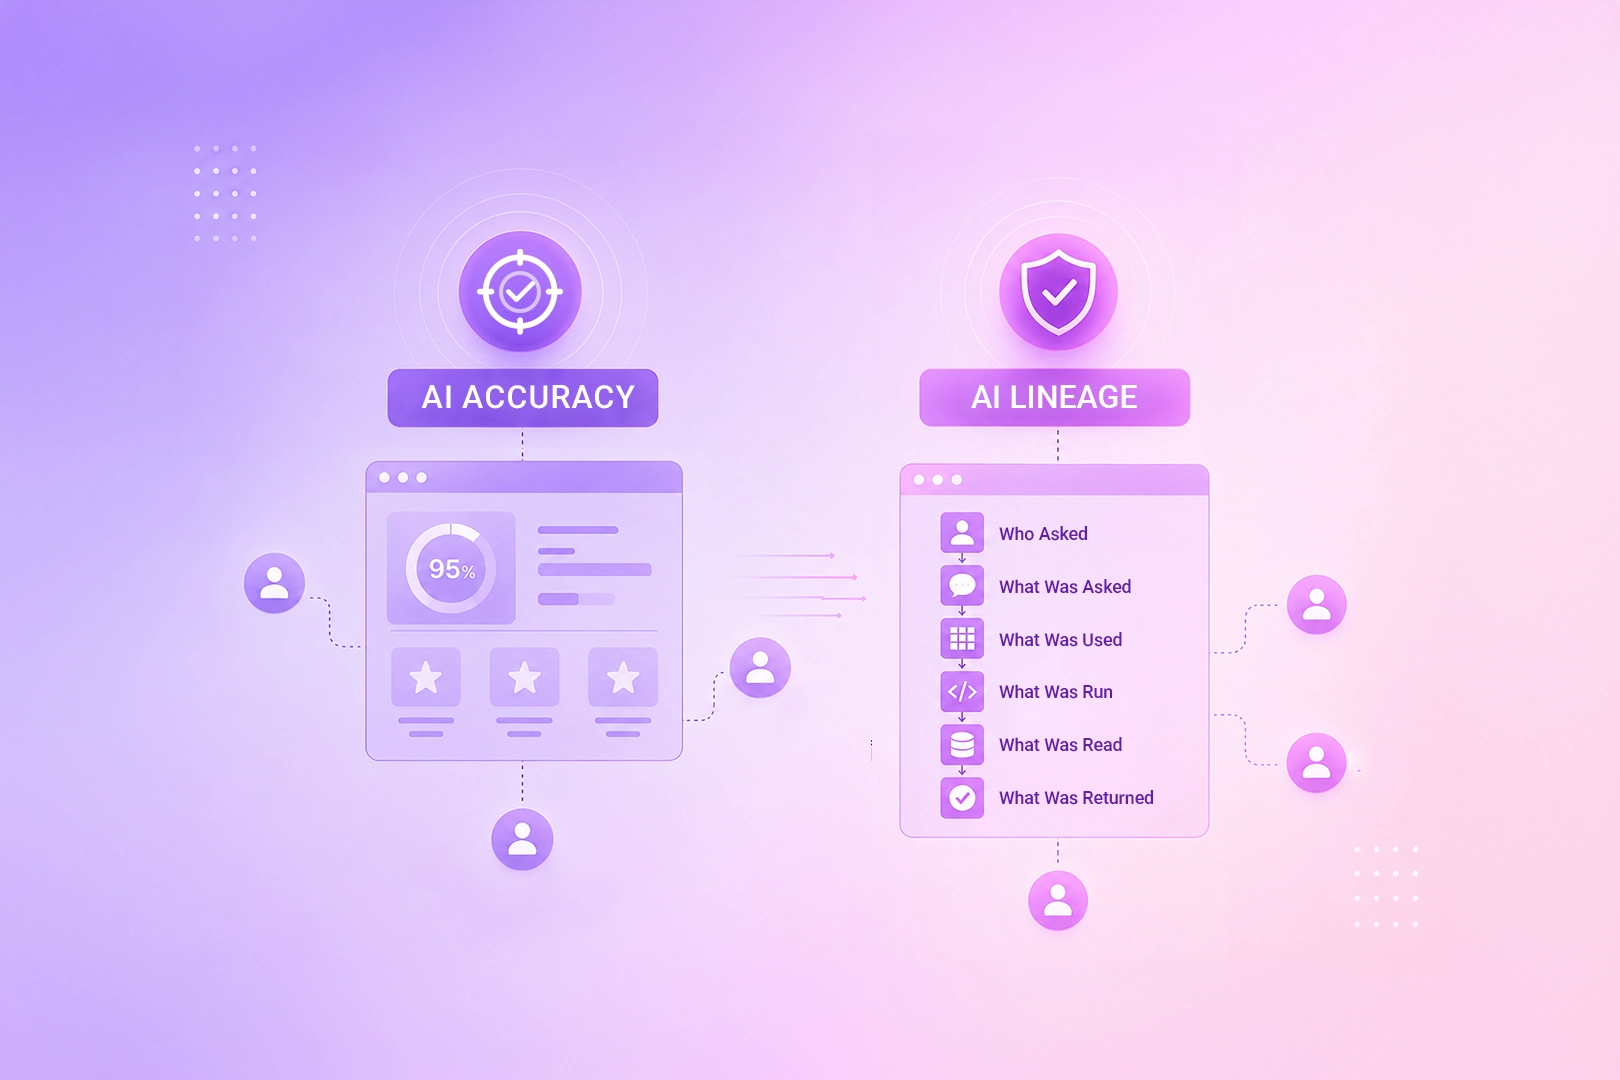
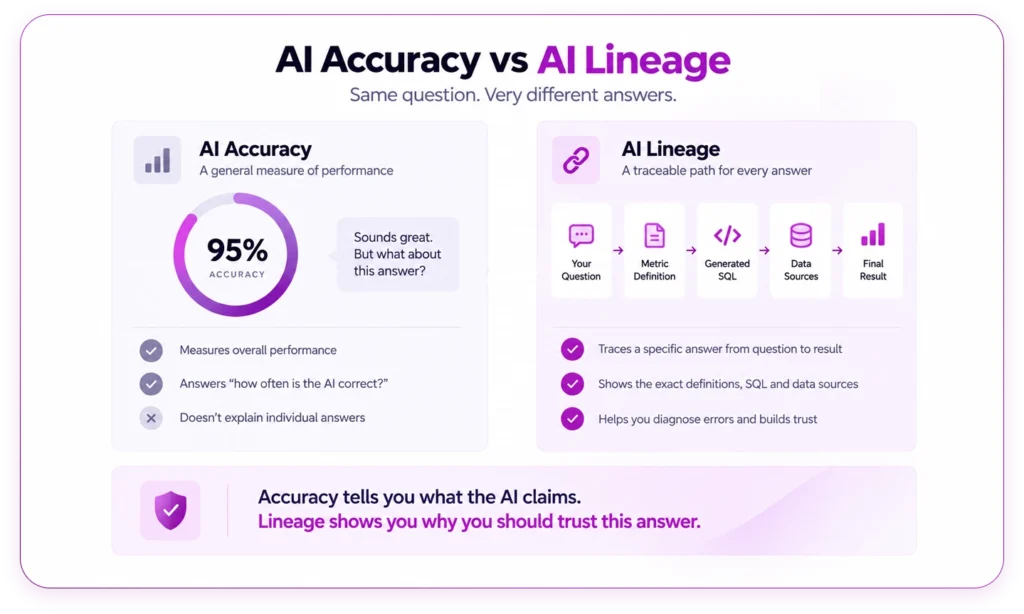
    Accuracy is the wrong first question about enterprise AI, and finance leaders are the first to figure this out. Not because accuracy is unimportant, but because accuracy is a claim, and CFOs are professionally trained to distrust claims they cannot verify. A vendor asserting 95 percent accuracy is telling the CFO nothing actionable. A vendor showing exactly how any individual answer was produced, from the question asked to the data read to the number returned, is telling the CFO something they can build a control around. The first is marketing. The second is lineage.

    Finance runs on traceability, not on averages

    Consider how a finance organisation already treats numbers. No controller accepts a figure into the close because the person who produced it is usually right. Every material number must tie back: to a ledger entry, to a reconciliation, to a documented source. The entire apparatus of financial control, from journal entry approval to SOX testing, is built on the principle that a number’s origin must be demonstrable, not merely trusted. Auditability is not a feature of financial reporting. It is the substance of it.

    An AI agent that produces analysis for finance is entering that apparatus, and the apparatus does not bend for new technology. When an agent’s output feeds a forecast, a close package, or a board deck, the CFO’s question is the same question finance asks of every number: show me where this came from. An aggregate accuracy statistic cannot answer it. The statistic says the system is right most of the time. The CFO needs to know whether it was right this time, and the only way to know is to trace this specific answer back through this specific chain.

    Accuracy without lineage is unverifiable, lineage makes accuracy testable

    Here is the asymmetry that puts lineage first. An accurate system with no lineage gives you correct answers you cannot prove are correct, which in a regulated finance context is nearly as unusable as wrong answers. A system with full lineage gives you something better than a promise: it gives you the means of verification. When every answer carries its question, its resolved metric definitions, its generated SQL, and its source tables, then accuracy stops being a vendor claim and becomes a property your own team can test, continuously, on your own data.

    Lineage is also what makes errors survivable. Every analytical system, human or machine, produces occasional wrong answers. In a lineage-complete system, a wrong answer is diagnosable: the reviewer finds the step where the chain went wrong, whether a misresolved definition or a flawed join, and the fix improves every subsequent answer. In a lineage-free system, a wrong answer is just a mystery that erodes trust, and there is nothing to fix because there is nothing to inspect. CFOs understand this instinctively, because it is exactly why finance documents its own work.

    The CFO is answerable for the number, so the CFO sets the bar

    There is a structural reason this question lands on the CFO’s desk with particular weight. When a figure reaches investors, the board, or a regulator, the CFO is personally accountable for it. Certification regimes in financial reporting attach executive names to reported numbers. An executive who signs numbers does not get to say the AI produced them. So before any AI-assisted analysis gets near external reporting, the CFO will require the same evidentiary standard applied to everything else in the reporting chain: complete, reviewable, retained documentation of origin. That standard has a name in this context, and it is lineage.

    The practical consequence for anyone selecting an analytics platform is that the finance organisation’s requirements will arrive whether or not they were in the original evaluation. Teams that select on demo quality and accuracy claims alone often discover the lineage requirement at the worst moment, when a number is already in circulation and someone senior asks for its provenance. Teams that select for lineage from the start never have that meeting.

    What to be able to show when the question comes

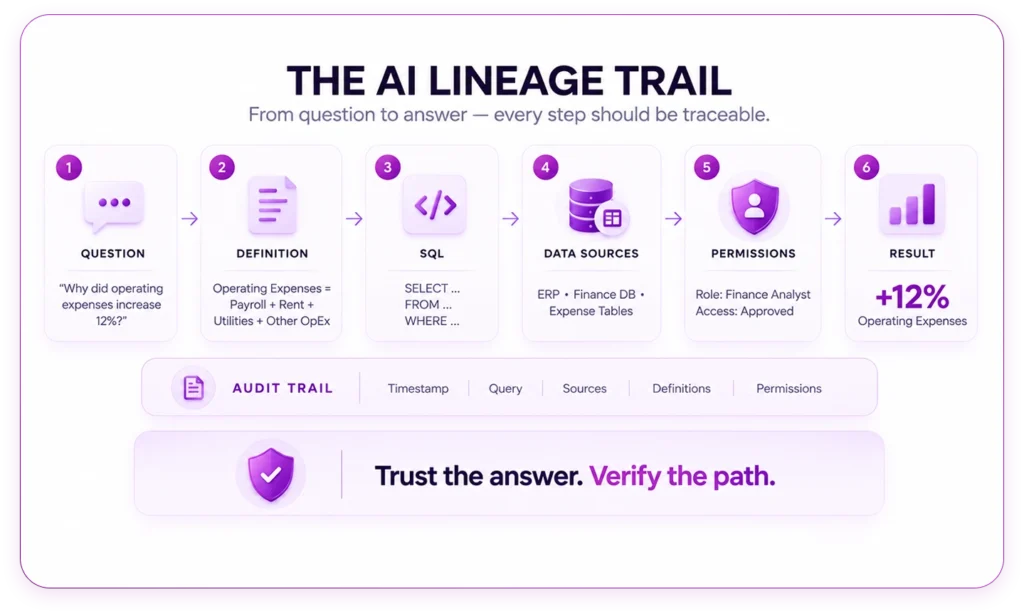
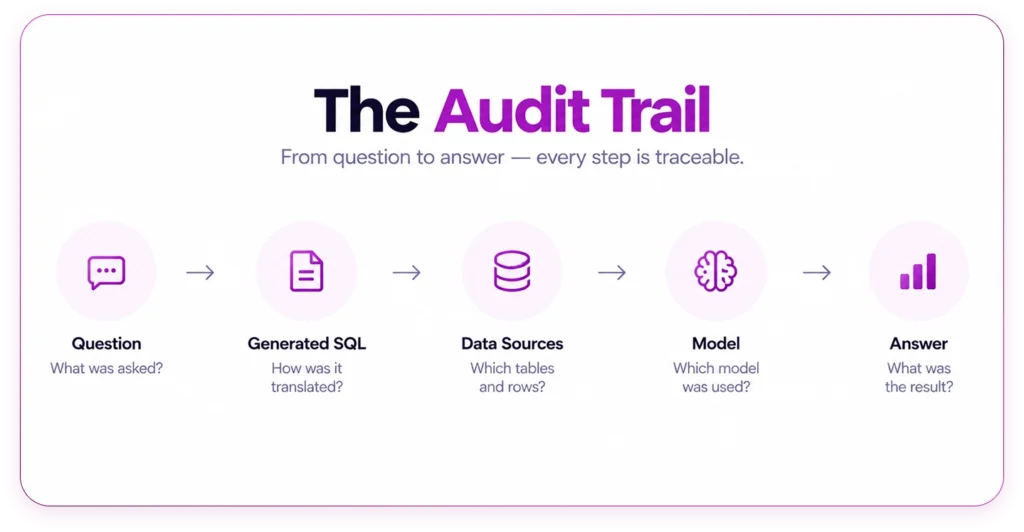
    The test is concrete. Take any single answer the platform has produced and demonstrate, from stored records rather than reconstruction, five things: who asked the question and under what permissions, the exact question asked, the certified definitions the question resolved against, the SQL executed and the tables it read, and the result returned. A platform built for governed agentic analytics produces this chain automatically on every query. Based on QuaerisAI customer deployments and published materials, this is the operating model behind results like a reduction from 170 hours to 70 hours on a standard audit engagement: when every answer arrives with its own evidence, the verification work that consumes senior hours collapses, because the proof was generated with the answer.

    Accuracy will always matter. But accuracy is what the system claims about itself, and lineage is what lets your CFO check. In finance, the checkable thing wins every time.

    Frequently asked questions

    What does AI lineage mean in analytics?

    AI lineage is the complete, recorded chain from a user’s question to the system’s answer: the identity and permissions of the asker, the question as phrased, the metric definitions it was resolved against, the query the system generated, the data sources that query read, the model that produced the reasoning, and the returned result. Data lineage traces where data came from. AI lineage extends the trace through the reasoning and generation steps as well.

    Is high accuracy enough for AI in financial reporting workflows?

    No. Financial reporting standards require that material numbers be supportable with documentation, not merely correct. An accurate answer with no reconstructible origin fails that test, because there is no evidence to review. In practice, lineage is the entry requirement and accuracy is what lineage lets you continuously verify.

    How should a finance team evaluate lineage in a vendor demo?

    Ask the vendor to pull the full record for one specific past query, live, without preparation. The record should show the asker, the prompt, the resolved definitions, the generated SQL, the tables touched, and the result, as one linked chain retrieved from storage. If producing it requires stitching together separate logs or engineering effort, the platform does not have lineage. It has logs.

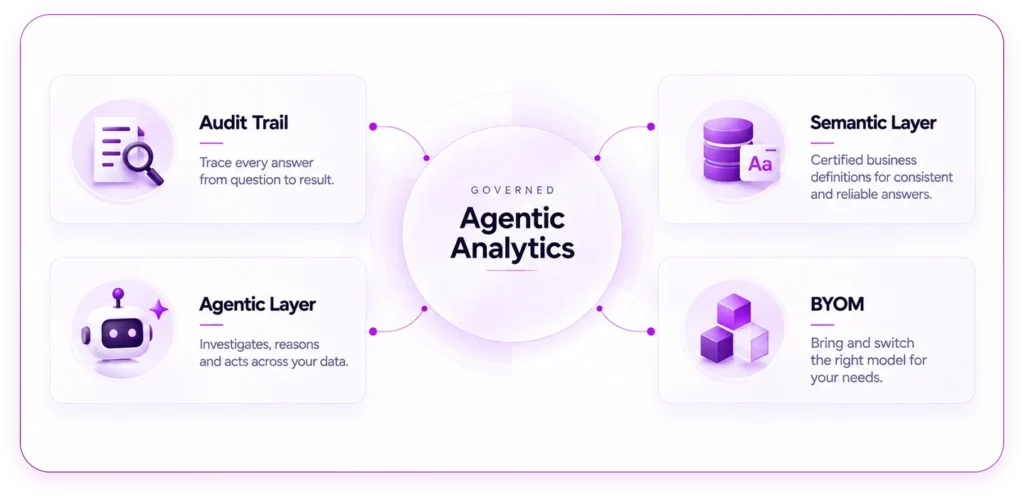
  • The four pillars of Governed Agentic Analytics: audit, semantic, agentic, BYOM

    The four pillars of Governed Agentic Analytics: audit, semantic, agentic, BYOM

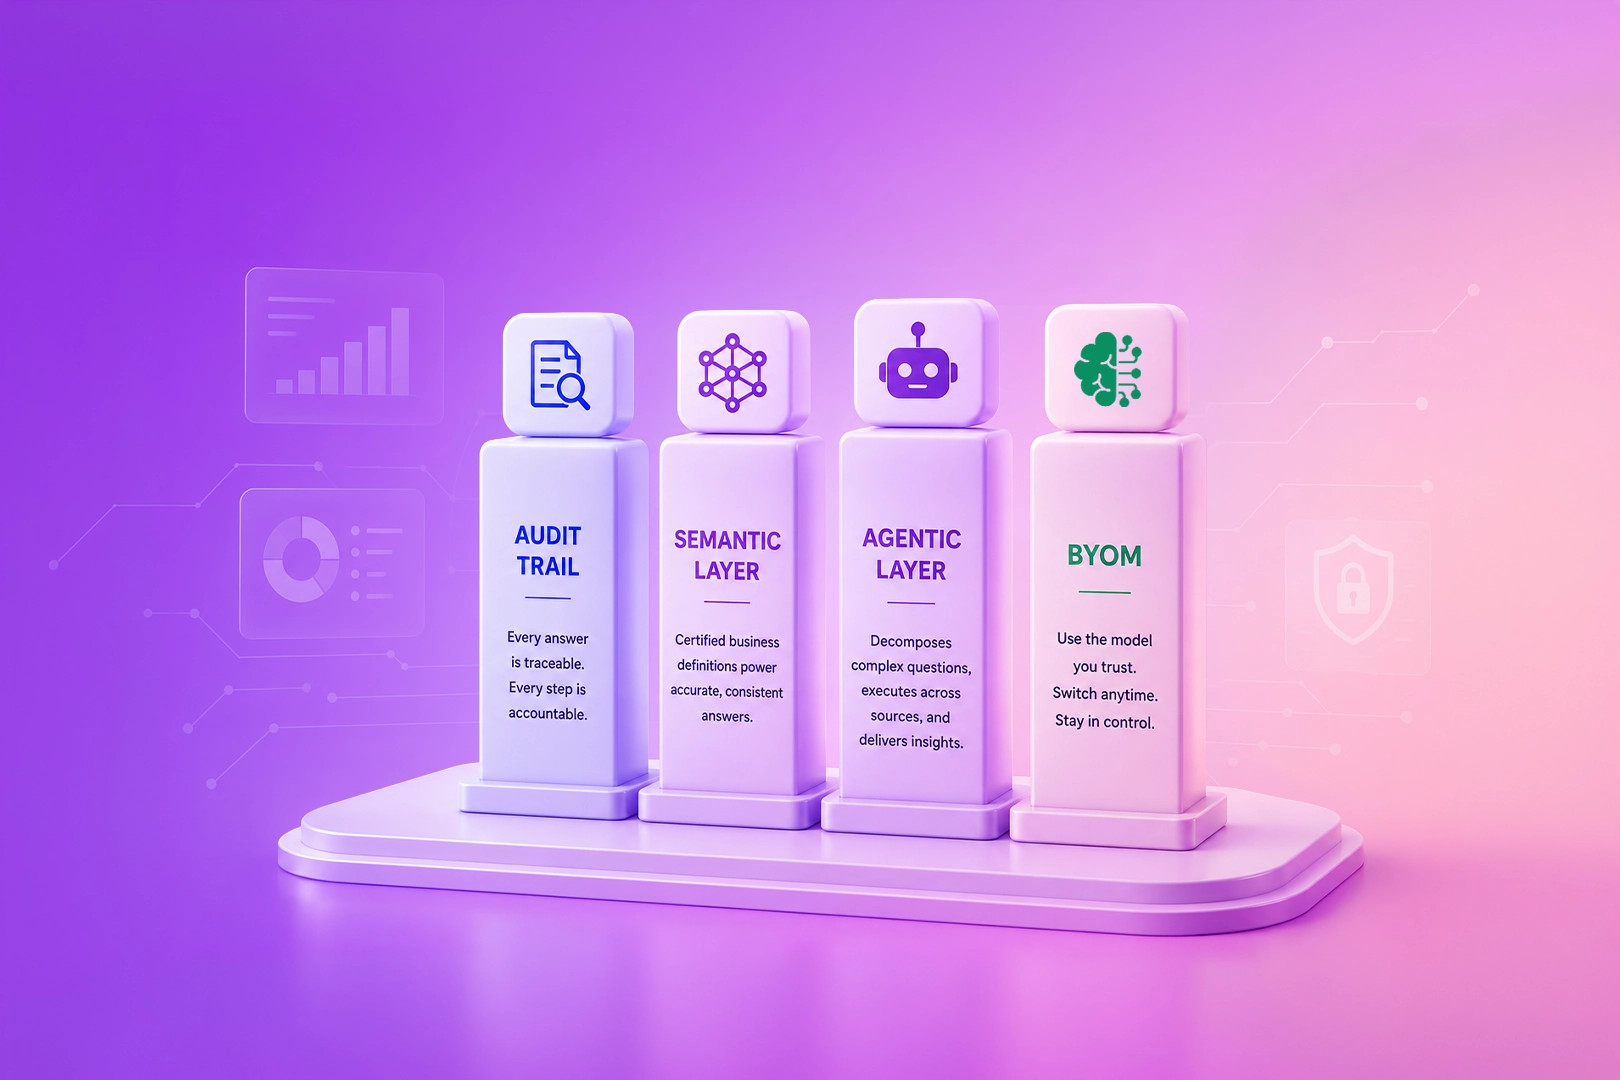
    Four capabilities separate a governed agentic platform from a chatbot bolted onto a warehouse. Remove any one of them and the structure fails in a specific, predictable way. This piece defines each pillar, explains what breaks without it, and shows how the four reinforce one another when they are built as one system rather than assembled from separate tools.

    Pillar one: the audit trail

    Every question asked of an agent should produce two artefacts: the answer, and the record of how the answer was produced. The audit pillar means logging the full chain on every interaction: who asked, what they asked, which SQL the agent generated, which tables and rows it touched, which model produced the reasoning, and what came back. This is the prompt-level audit trail, and it is the difference between an answer you can act on and an answer you can defend.

    Without it, every agent response is an orphan. When a number in a board deck is challenged three months later, there is no way to reconstruct where it came from. Internal audit cannot test the system. Regulators in banking, insurance, and healthcare cannot accept its outputs as evidence. The absence of an audit trail does not make an agent less useful day to day. It makes the agent indefensible on exactly the day it matters most.

    Pillar two: the semantic layer

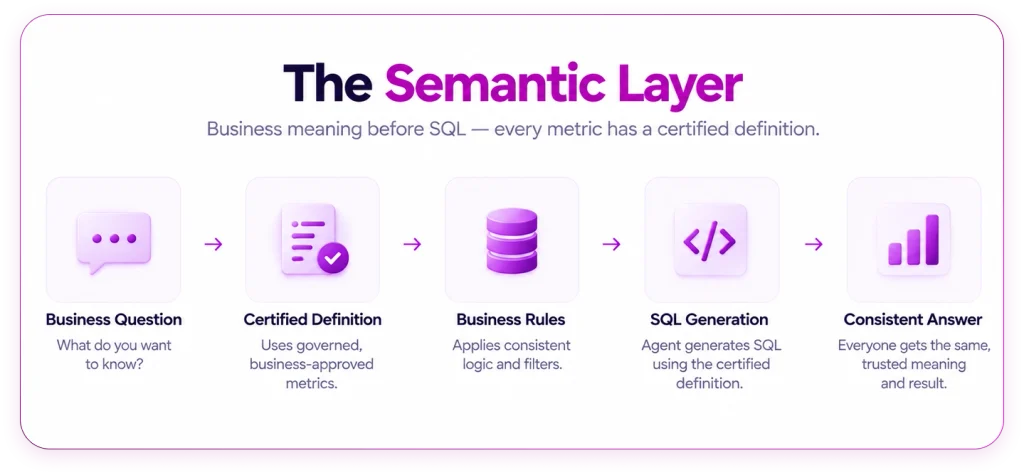
    An agent is only as accurate as its understanding of what the business means by its own words. The semantic pillar supplies that understanding: certified definitions of metrics, dimensions, and business terms that the agent consults before it writes a line of SQL. When someone asks about net revenue, the agent does not guess which of the fourteen revenue-adjacent columns in the warehouse to use. It uses the one the business certified.

    QuaerisAI’s Smart Semantic Layer adds a property that distinguishes it from manually authored alternatives: it learns. When an analyst corrects a definition or refines a query, the correction feeds back into the layer, so the next person asking a similar question benefits from it. Without a semantic layer of some kind, an agent hallucinates business logic, and it does so fluently, which is worse than failing loudly. Confidently wrong answers are the fastest way to destroy trust in an analytics deployment.

    Pillar three: the agentic layer

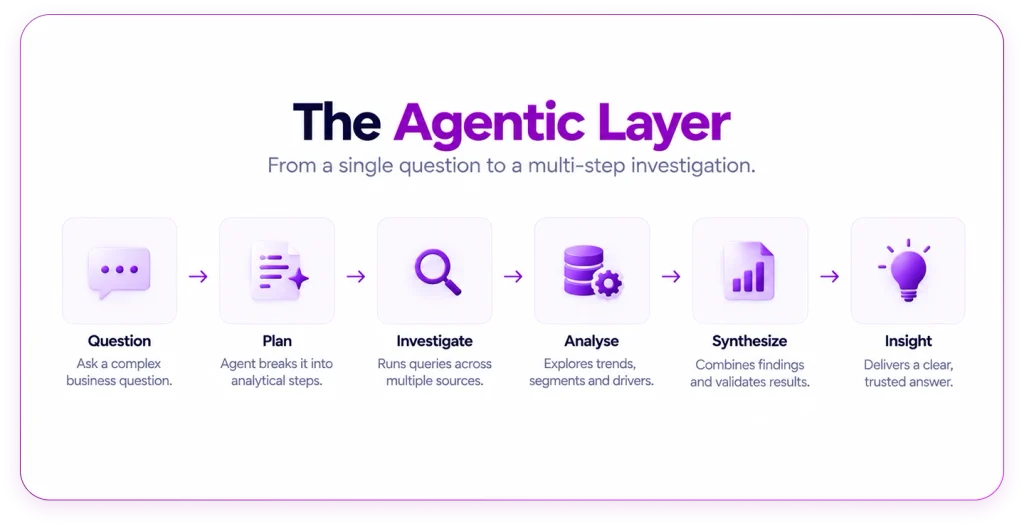
    The agentic pillar is what makes the platform more than search. Real analytical questions are rarely answered by one query. Why did margin dip in the northeast last quarter is a plan: pull the margin trend, decompose it by product line, check input costs, compare against the same period last year, and assemble a finding. The agentic layer is the capability to decompose a question into steps, execute them across structured and unstructured sources, and synthesise a result, autonomously.

    Without it, the platform is a text-to-SQL translator: useful for single-shot lookups, incapable of investigation. The user gets a number when they needed an explanation. The distinction matters commercially because the investigation work is where the senior-staff hours actually go. Based on QuaerisAI customer deployments and published materials, agentic deployment in audit engagements has reduced standard engagement time from 170 hours to 70 hours, a 59 percent reduction, precisely because the multi-step work is where the time was.

    Pillar four: BYOM

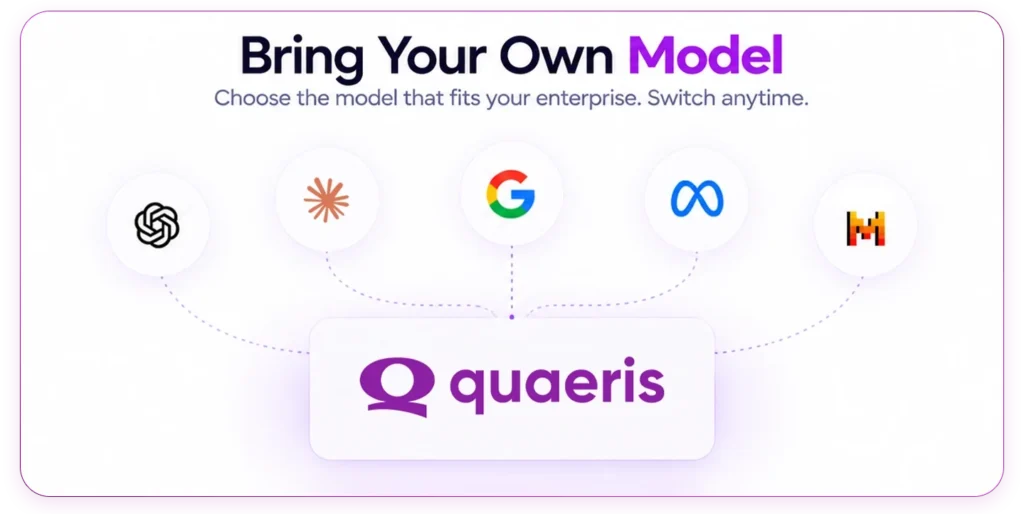
    Bring your own model means the platform runs on the language model the enterprise chooses, whether from Anthropic, OpenAI, Google, or Meta, rather than binding the customer to a single vendor’s model. This pillar looks like a procurement detail until the first time it is tested. A compliance team mandates a specific model for data-residency reasons. A model vendor changes pricing. A new model release outperforms the incumbent on SQL generation. In a BYOM architecture, each of these is a configuration decision. In a locked architecture, each is a re-platforming project.

    BYOM also changes the negotiating position. An enterprise that can switch models holds pricing power an enterprise that cannot switch has surrendered. And for regulated buyers, model choice is increasingly a compliance requirement in its own right, because model provenance is becoming part of what auditors and regulators expect organisations to document.

    Why the pillars only work together

    The four pillars are not a feature list. They are load-bearing in combination. The audit trail is only meaningful if the semantic layer makes answers deterministic enough to be worth auditing. The semantic layer only pays for itself when an agentic layer is asking it thousands of questions a day. The agentic layer is only deployable in the enterprise because the audit trail makes its autonomy accountable. And BYOM keeps the whole structure durable as the model market shifts underneath it.

    This is why assembling the equivalent from point solutions rarely works. A logging tool, a metrics store, an agent framework, and a model gateway from four vendors produce four integration seams, and governance fails at seams. Governed Agentic Analytics is one architecture, and the four pillars are its definition.

    Frequently asked questions

    Which pillar should an evaluation test first?

    The audit trail, because it is the hardest to retrofit and the easiest to verify in a demo. Ask the vendor to show the complete record for a single query: the prompt, the generated SQL, the tables touched, the model used, and the result. If that record does not exist or requires engineering effort to produce, the other three pillars are standing on sand.

    Is a semantic layer still necessary if the model is very capable?

    Yes. Model capability improves general reasoning, but no model can know that your finance team excludes intercompany transfers from net revenue, or that fiscal Q1 starts in February. Those are facts about your business, not facts about the world, and they have to be supplied by a governed definition layer. Stronger models make the semantic layer more valuable, not less, because they execute certified definitions more reliably.

    Does BYOM mean the customer manages model infrastructure?

    No. BYOM in the QuaerisAI architecture means the customer selects which model powers the platform, from providers including Anthropic, OpenAI, Google, and Meta, and can change that selection. The platform handles the integration. The customer holds the choice.

  • Why Data Value Is Realized at the Moment of Decision

    Why Data Value Is Realized at the Moment of Decision

    Every organisation collecting data is making an implicit bet: that the data will eventually influence a decision. The size of the data warehouse, the sophistication of the pipeline, the number of dashboards maintained, none of it has inherent value. The value only materialises at the moment a decision is made better because of it. Everything before that moment is cost. The decision is the return.

    This framing matters because most organisations measure the wrong things. They track data volume, dashboard usage, and query counts. They rarely track how often a business decision was made faster, or more accurately, because of the data available to the person making it. The gap between those two measurement approaches explains why organisations can have world-class data infrastructure and still feel like they are flying blind.

    The Distance Between Data and Decision

    In most enterprises, data and decisions do not live in the same place. Data lives in warehouses, pipelines, and dashboards maintained by a technical team. Decisions live in meetings, calls, and planning cycles run by business leaders. The distance between the two is bridged by a process: someone with a question requests an answer from someone with data access, waits for it, receives it, and then decides whether to trust it enough to act on it.

    Every step in that process introduces delay. And delay has a specific cost in decision-making contexts: the window to act narrows, the situation changes, and the answer that arrives is answering a slightly different question than the one that was asked. By the time a finance leader has a verified variance analysis, the budget cycle that needed it may have already closed. By the time a sales director has pipeline coverage data, the quarter it was meant to inform is already in its final week.

    The data existed. The decision was still made without it, or made on older data that was less accurate. The value that could have been realised was not, because the timing was wrong.

    Why Timing Is the Underrated Variable

    Most conversations about data quality focus on accuracy. Most conversations about data access focus on permissions and tooling. Relatively few focus on timing, even though timing is frequently the variable that determines whether data influences a decision at all.

    A perfectly accurate answer that arrives two days after the decision was made has a value of zero to that decision. An answer that is 95% accurate and arrives before the meeting starts has real value. This is not an argument for trading accuracy for speed. It is an argument that the delivery architecture matters as much as the data itself, and that most organisations have invested heavily in the former without solving the latter.

    The organisations where data consistently influences decisions are not necessarily the ones with the most data or the most sophisticated models. They are the ones where the person making the decision can get a trustworthy answer before the decision point, not after it.

    What Breaks the Connection Between Data and Decision

    Three structural problems account for most of the gap between data availability and decision quality in large organisations.

    The first is access friction. Getting an answer requires knowing which dashboard contains the relevant metric, understanding how to interpret it, and trusting that the definition it uses matches what the business actually means by that term. For non-technical decision makers, these requirements are often too high. They either rely on an analyst intermediary, which introduces delay, or they make the decision without the data, which introduces risk.

    The second is definition inconsistency. When the same question asked by two different teams returns two different numbers, the result is not just confusion. It is a systematic erosion of trust in data as a decision-making input. Once a finance director has been burned by a discrepancy between what the CRM reports and what the ERP reports, they begin treating data as a starting point for a debate rather than a basis for a decision.

    The third is reactive intelligence. Most analytics infrastructure is built to answer questions after they are asked. It is not built to surface the information a decision maker needs before they know they need it. A sales leader should not have to remember to check pipeline coverage every Friday morning. The system should alert them when coverage drops below the threshold that matters, at the moment it happens.

    What Changes When Data Reaches the Decision

    When these structural problems are addressed, the nature of the relationship between data and decisions changes in a concrete way. Decision makers stop treating data as something that requires effort to reach and start treating it as something that is already present when they need it. The question “do we have data on this?” is replaced by “what does the data say?” That shift, while it sounds simple, represents a fundamentally different operating model.

    The decisions that benefit most from this shift are not the large strategic ones that get weeks of analysis time. Those decisions already get the data they need. The decisions that change are the daily and weekly ones: which accounts to prioritise, whether a budget variance warrants immediate action, which operational metrics are drifting outside acceptable ranges. These decisions are made constantly, they are made quickly, and they are made with whatever information is immediately to hand. When that information is accurate and governed, the cumulative effect on business outcomes is significant.

    The Governance Requirement

    Speed without trust does not solve the problem. If a business leader receives a fast answer but cannot verify where it came from, whether the metric definition matches the one used in last quarter’s board presentation, or whether they were supposed to have access to that data at all, the answer will not influence the decision. It will trigger a verification process that reintroduces the same delay the speed was meant to eliminate.

    This is the fundamental weakness of general-purpose AI tools applied to business data questions. They can generate answers quickly. They cannot guarantee that those answers are grounded in the organisation’s actual definitions, drawn from authorised data sources, and scoped to the querying user’s role. For a finance leader making a budget decision, or a compliance officer reviewing a control exception, that guarantee is not optional. It is the difference between an answer they can act on and an answer they have to verify before they can act on it.

    Governed analytics addresses this by ensuring every answer carries its source, its metric version, and its access record. The decision maker does not need to trust the system blindly. They can verify the answer the same way they would verify any other business number, which means they actually use it.

    The Measure That Actually Matters

    If an organisation wants to understand whether its data investment is delivering returns, the most useful question is not how much data it has, how many dashboards it maintains, or how many queries it processes per month. The most useful question is: how often does a decision maker have the information they need, at the moment they need it, in a form they trust enough to act on?

    Every other metric is a proxy for that one. And every investment in data infrastructure that does not ultimately improve that number is investment that has not yet reached the point where value is created.

    Data value is not realised when data is collected. It is not realised when data is stored, processed, or visualised. It is realised at the moment a decision becomes better because of it. Building the infrastructure that connects those two things is the actual problem worth solving.