Category: Agentic AI

  • The Language Between LLMs and Charts

    The Language Between LLMs and Charts

    TL;DR

    • A convincing chart can still answer the wrong question. Terms such as “performance,” “average,” and “underperformer” require clear business definitions before AI generates a visualization.
    • Preserve intent from question to chart. Metric selection, calculations, filters, comparisons, and visual emphasis must remain aligned. Low revenue, for example, does not necessarily mean a region missed its target.
    • Structured specifications make charts easier to inspect and revise. ThoughtSpot’s ChartSpec separates AI interpretation from software-driven chart construction and validation. It is a vendor implementation, not a universal industry standard.
    • Follow-up questions should maintain analytical continuity. Changing a highlight or reporting period should preserve other relevant choices unless the user requests otherwise.
    • Chart specifications alone cannot establish trust. Enterprise analytics also needs consistent business definitions, appropriate access controls, reliable calculations, and traceability.
    • Conversational analytics is evolving. The blog discusses Google Cloud, Tableau, and Microsoft approaches that connect natural-language interaction with semantic models, agents, or approved visual answers.
    • Evaluate beyond the first chart. Ask a business question, request a target comparison, change the reporting period, ask why something is highlighted, and inspect whether the interpretation remains consistent. Ambiguity should trigger clarification.
    • Quaeris.AI’s focus is governed agentic analytics. Its positioning connects business context, trusted AI agents, and controlled decision support. Specific capabilities should be assessed through demonstrated product workflows.

    The central takeaway: Trustworthy AI analytics must help users understand why an answer deserves confidence—not simply produce charts quickly.

    Building Trustworthy AI Analytics for Enterprise Decisions

    The Language Between LLMs and Charts: Why Enterprise AI Needs More Than an Answer

    Some of the most dangerous words in enterprise analytics are the shortest ones. Average. Performance. Underperformer. Each sounds precise. Each hides a decision that changes what a chart actually says.

     Marketing sees a campaign performing exceptionally well. Finance questions the revenue calculation. Sales asks why existing customers were included in a new-business comparison.

    Everyone is looking at the same visualization. Yet everyone may be interpreting a different answer.

    This is one of the challenges of conversational analytics: An AI system can generate a chart that looks convincing without necessarily capturing the business question correctly.

    Large language models (LLMs) make it easier than ever to ask questions in natural language. You can type, “Show me sales by region, highlight the underperformers, and add an average line.” But turning that request into a reliable business answer requires more than generating a chart.

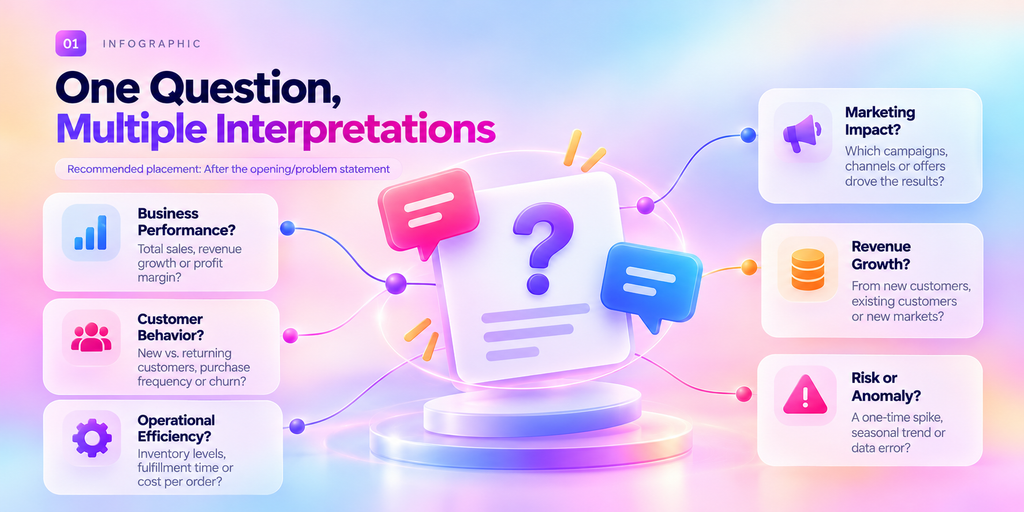
    Which sales metric should be used? What defines an underperformer? Should the average be calculated across regions or weighted by sales volume? Which data should the user be allowed to access?

    These decisions determine what the visualization communicates.

    The missing piece is a structured connection between human intent, business meaning, analytical calculations, and visual representation.

    And as enterprise organizations move toward agentic analytics, that connection becomes increasingly important.

    The Real Problem: An LLM Can Understand a Question. Can It Preserve Its Meaning?

    A natural-language request often appears simple.

    “Show campaign performance by region, highlight the underperformers, and add an average.”

    But what does performance mean?

    • Revenue generated?

    • Qualified leads?

    • Conversion rate?

    • Return on advertising spend?

    And what does underperformer mean?

    • A region below its target?

    • A region performing below the company average?

    • A region declining compared with the previous period?

    Even the word average requires context. An average across regional revenue may answer a different question from an average transaction value.

    Before a visualization is created, the system needs to resolve these ambiguities.

    This matters because a chart can be technically well-rendered and still answer the wrong question.

    Consider a sales manager who wants to identify regions missing their targets.

    A chart that simply highlights the shortest revenue bars could mislead the manager. A smaller region may have lower revenue but still exceed its target, while the region with the highest revenue may be underperforming against its own goal.

    Revenue determines the bar length. Performance against target determines the emphasis.

    The distinction is not cosmetic. It changes the business interpretation.

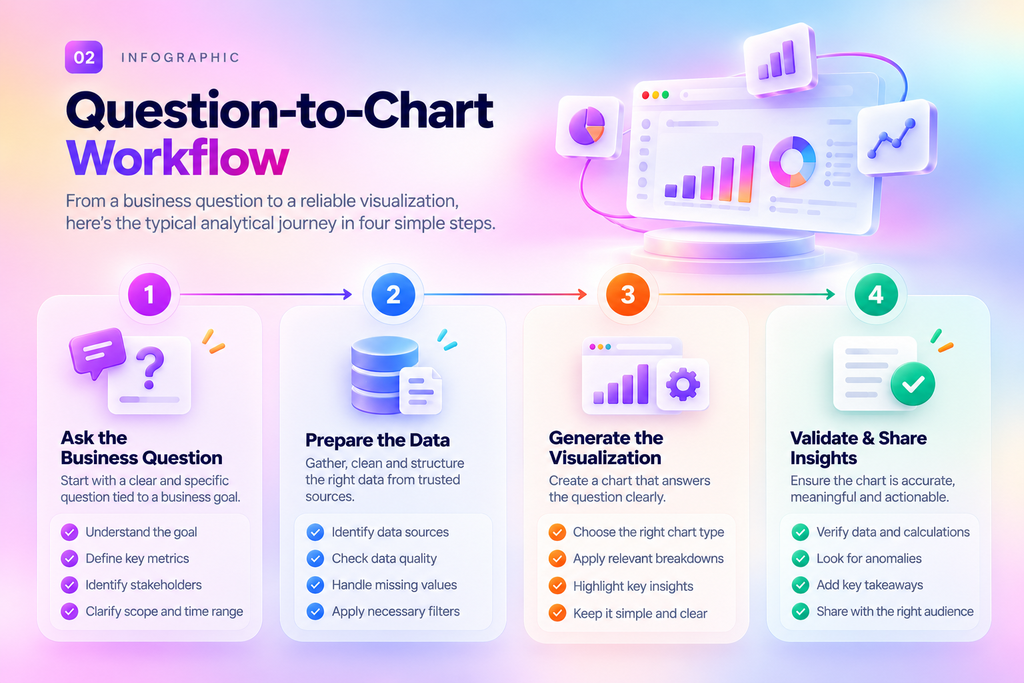
    From Business Question to Reliable Visualization

    A dependable AI analytics experience needs a way to preserve the meaning of a user’s request throughout the analytical process.

    Each stage addresses a different potential failure.

    A metric can be defined incorrectly. A calculation can use the wrong population. A chart can emphasize a comparison that does not match the question. A visual can be technically correct but difficult to interpret.

    The objective is not merely to generate an attractive chart. It is to create a visual representation that users can examine, question, and refine.

    What ChartSpec Teaches Us About AI-Generated Charts

    ThoughtSpot’s ChartSpec provides an example of how a structured language can connect analytical intent with visualization.

    According to ThoughtSpot’s explanation, ChartSpec describes visual elements and relationships, allowing software to construct and validate chart structures. It separates the model’s interpretation from the code that generates the visualization.

    This approach illustrates an important principle: AI should not have to communicate its entire analytical intent through an unconstrained visual output.

    A structured representation can make parts of that intent explicit, including:

    • Which fields are being used.

    • How data is grouped or compared.

    • Which calculations are applied.

    • What visual emphasis is required.

    • How follow-up changes should be handled.

    For example, a user might say: “Keep the same comparison, but highlight regions below target.”

    The intended change is narrow. The measure, reporting period, and population should remain consistent unless the user requests otherwise.

    A structured representation provides a way for software to distinguish the requested edit from an unintended change to the analysis.

    ChartSpec is ThoughtSpot’s implementation, not an established universal industry standard. Its broader lesson is that the meaning behind a chart needs a representation that systems can inspect and revise.

    Why Business Context Matters More Than Ever

    The language between LLMs and charts is only one part of the larger enterprise analytics challenge.

    A chart specification can describe how a metric should be displayed. It does not, by itself, determine whether the underlying metric has the correct business definition or whether the user should have access to the data.

    These responsibilities must work together.

    1. Business definitions

    Two departments may use the same term but mean different things. For example, revenue could refer to recognized revenue, billed revenue, or a particular reporting period. AI analytics needs access to the relevant business definitions to avoid confusing similar concepts.

    2. Governed access

    Enterprise data is not universally accessible to every user. Role-based permissions and appropriate access controls are important when analytics systems interact with sensitive business information.

    3. Calculation consistency

    A chart should use the appropriate calculation for the question. An average, growth rate, or comparison can produce different interpretations depending on the underlying data and formula.

    4. Traceability

    When a business user questions an insight, they should have a way to understand the basis of the answer where the system supports it.

    Together, these considerations point toward a broader principle:

    Trustworthy AI analytics requires more than conversational interaction. It requires governed meaning, reliable calculations, and transparent analytical behavior.

    What the Industry Is Moving Toward?

    Developments across the analytics industry demonstrate that conversational analytics is expanding beyond simple question-and-answer experiences.

    Google Cloud has described conversational analytics capabilities in BigQuery and Looker, including workflows involving data exploration and agents. Tableau has discussed conversational experiences grounded in semantic models and connections to external agents. Microsoft Power BI includes verified answers for recurring questions through approved visual responses.

    These approaches operate at different layers of the analytics experience. They do not establish a shared industry-wide chart specification standard.

    However, they illustrate an important direction: enterprises need ways to combine natural-language interaction with business definitions, data access, and consistent analytical outputs.

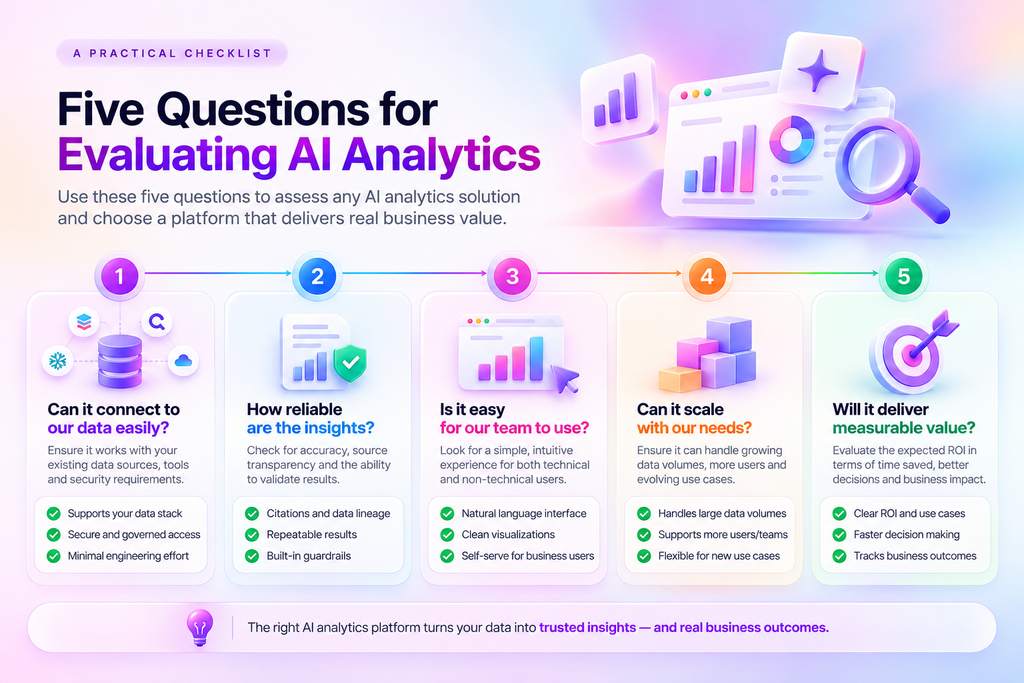
    For organizations evaluating AI analytics platforms, the important question is not simply: “Can the system generate a chart?”

    It is: “Can the system preserve the meaning of my business question and help me trust the answer?”

    From AI-Generated Insights to Governed Agentic Analytics

    This is where the conversation extends beyond chart generation.

    Enterprise teams increasingly want AI to do more than retrieve information. They want systems that can help investigate trends, identify exceptions, explain performance changes, and support business decisions.

    But increased autonomy also raises important questions:

    • Which data can an agent access?

    • Which business definitions should it use?

    • How are calculations validated?

    • Can users understand the basis of its conclusions?

    • What happens when the question is ambiguous?

    At Quaeris.ai, our positioning around Governed Agentic Analytics is built around the importance of trusted analytics, business context, and controlled AI-driven decision support.

    Our perspective is that enterprise AI should not be defined only by how naturally it can respond. It should also be evaluated by how reliably it operates within the business’s definitions, permissions, and governance requirements.

    That means the conversation should move beyond “Ask your data anything” toward a more meaningful question:

    Can your AI help your teams make decisions using analytics they can trust?

    Quaeris.ai’s specific capabilities, integrations, and validation mechanisms should be evaluated against this principle and demonstrated through real product workflows.

    A Practical Way to Evaluate AI Analytics

    The next time you evaluate an AI-powered analytics experience, don’t stop after the first chart.

    Try a short sequence of follow-up questions.

    Step 1: Ask a business question

    “Show campaign performance by region.”

    Step 2: Request a comparison

    “Highlight regions performing below their targets.”

    Step 3: Change the reporting period

    “Now show the same analysis for the previous quarter.”

    Step 4: Ask for an explanation

    “Why is this region highlighted?”

    Step 5: Inspect the answer

    Check whether the definitions, calculations, filters, and visual emphasis still match the original intent.

    This sequence can help reveal whether the system handles analytical continuity and transparency effectively.

    A reliable experience should also be willing to ask for clarification when the question is ambiguous.

    For example: “When you say ‘best campaign,’ do you mean revenue, profitability, or conversion rate?”

    Sometimes the most useful response an AI system can provide is not a chart. It is a clarifying question.

    The Future of AI Analytics Is More Than Faster Charts

    The evolution of conversational analytics is not simply about making chart generation faster.

    It is about making the relationship between questions, data, calculations, and visual explanations more dependable.

    As AI analytics becomes part of enterprise workflows, users will increasingly expect to:

    • Understand what a metric represents.

    • Inspect the basis of an analytical answer.

    • Refine a visualization without accidentally changing the underlying question.

    • Work with data within appropriate governance controls.

    • Move from insights toward informed business decisions.

    A structured language between LLMs and charts is one possible component of that future. It helps make visual intent more explicit and provides a basis for examination and revision.

    But reliable enterprise analytics requires the larger system to work together: business meaning, governed data, analytical reasoning, and visualization.

    The real test of AI analytics begins after the first chart.

    When someone points to a visualization and asks, “Why should I believe this?”—the system should have a meaningful way to help them understand the answer.

    How Quaeris.ai Approaches Trusted Analytics

    Enterprise decisions deserve more than fast answers. They need context, consistent metrics, and governance.

    Quaeris.ai’s Governed Agentic Analytics positioning focuses on connecting enterprise analytics with trusted AI agents and decision intelligence.

    Explore how Quaeris.ai can support your organization’s approach to governed analytics and AI-driven decision-making.

    Ready to Explore Governed Agentic Analytics? Discover how Quaeris.ai approaches trusted analytics and enterprise decision intelligence.
  • Analytics Without Data Movement: Why Level-Zero Data Should Stay in Source

    Analytics Without Data Movement: Why Level-Zero Data Should Stay in Source

    TL;DR 

    “Analytics without data movement” is an architectural approach where your business intelligence (BI) layer queries data where it already lives in your warehouse, lakehouse, or operational database instead of copying raw, granular records into a separate analytics platform or the vendor’s cloud. The most sensitive layer of your data, often called level-zero data (the raw, row-level source of truth), never leaves the source system. 

    Why it matters. Every copy of raw data you create is a new place it can leak, a new system to govern, and a new jurisdiction it might cross. The traditional “extract everything into the analytics tier first” model quietly expands your attack surface and complicates data residency compliance. The average data breach now costs $4.88 million globally, and cumulative GDPR fines have passed €7.1 billion — so an extra unguarded copy of your customer data is not a small liability. 

    Key takeaways. 

    Copying level-zero data into a BI platform creates a second, often less-governed, attack surface. 

    Query-in-place (zero-copy) analytics sends the query to the data instead of moving the data to the query. 

    Keeping data in source preserves existing permissions, encryption, and residency boundaries if a user can’t see a row in the source, they can’t see it in analytics. 

    This is a defensible, technical-buyer message: fewer copies, less leakage surface, simpler compliance. 

    Who should read this. Security and compliance leaders, data platform owners, and architects who need analytics to be useful and safe — and who are tired of choosing between the two. 

    Ready to see how it works? 

    Table of Contents 

    What “Analytics Without Data Movement” Actually Means 

    The Hidden Cost of the Traditional BI Copy Model 

    What Is Level-Zero Data — and Why It’s the Real Risk 

    How Query-in-Place Analytics Works 

    Data Residency: The Compliance Case for Keeping Data in Source 

    Security Benefits: Shrinking the Attack Surface 

    Architecture Patterns and How to Choose 

    Implementation: A Practical Migration Path 

    Real-World Scenarios 

    Common Mistakes to Avoid 

    Advanced Insights and Future-Proofing 

    Frequently Asked Questions 

    Conclusion 

    Introduction 

    Here’s a question most analytics buyers never ask their BI vendor: Where does my raw data physically go the moment I connect you? 

    For most traditional business intelligence tools, the answer is uncomfortable. To make dashboards fast, the platform ingests your data — it copies granular, row-level records out of your warehouse and into its own analytics engine, its own cache, and frequently its own cloud. You connected a reporting tool. What you actually did was create a second full copy of your most sensitive data in a system your security team may not fully control. 

    For years this was treated as the unavoidable cost of doing analytics. Fast dashboards required local copies; local copies required data movement; data movement was just how BI worked. But that assumption is now expensive in three different currencies: security risk, compliance exposure, and operational drag. 

    The regulatory environment has made the stakes concrete. Global enterprises now navigate 120+ data protection regulations across 190+ countries, GDPR penalties can reach €20 million or 4% of global turnover, and the average breach costs nearly $5 million. In that world, every redundant copy of raw customer data is a standing liability — not a convenience. 

    This article makes the case for a different default: analytics without data movement. We’ll define what level-zero data is and why it’s the part that actually matters, walk through how query-in-place analytics works, and lay out the security, residency, and architectural reasons to keep raw data in its source. By the end you’ll have a clear framework for evaluating any analytics tool through a single lens — does this make another copy of my data, or not? 

    What “Analytics Without Data Movement” Actually Means 

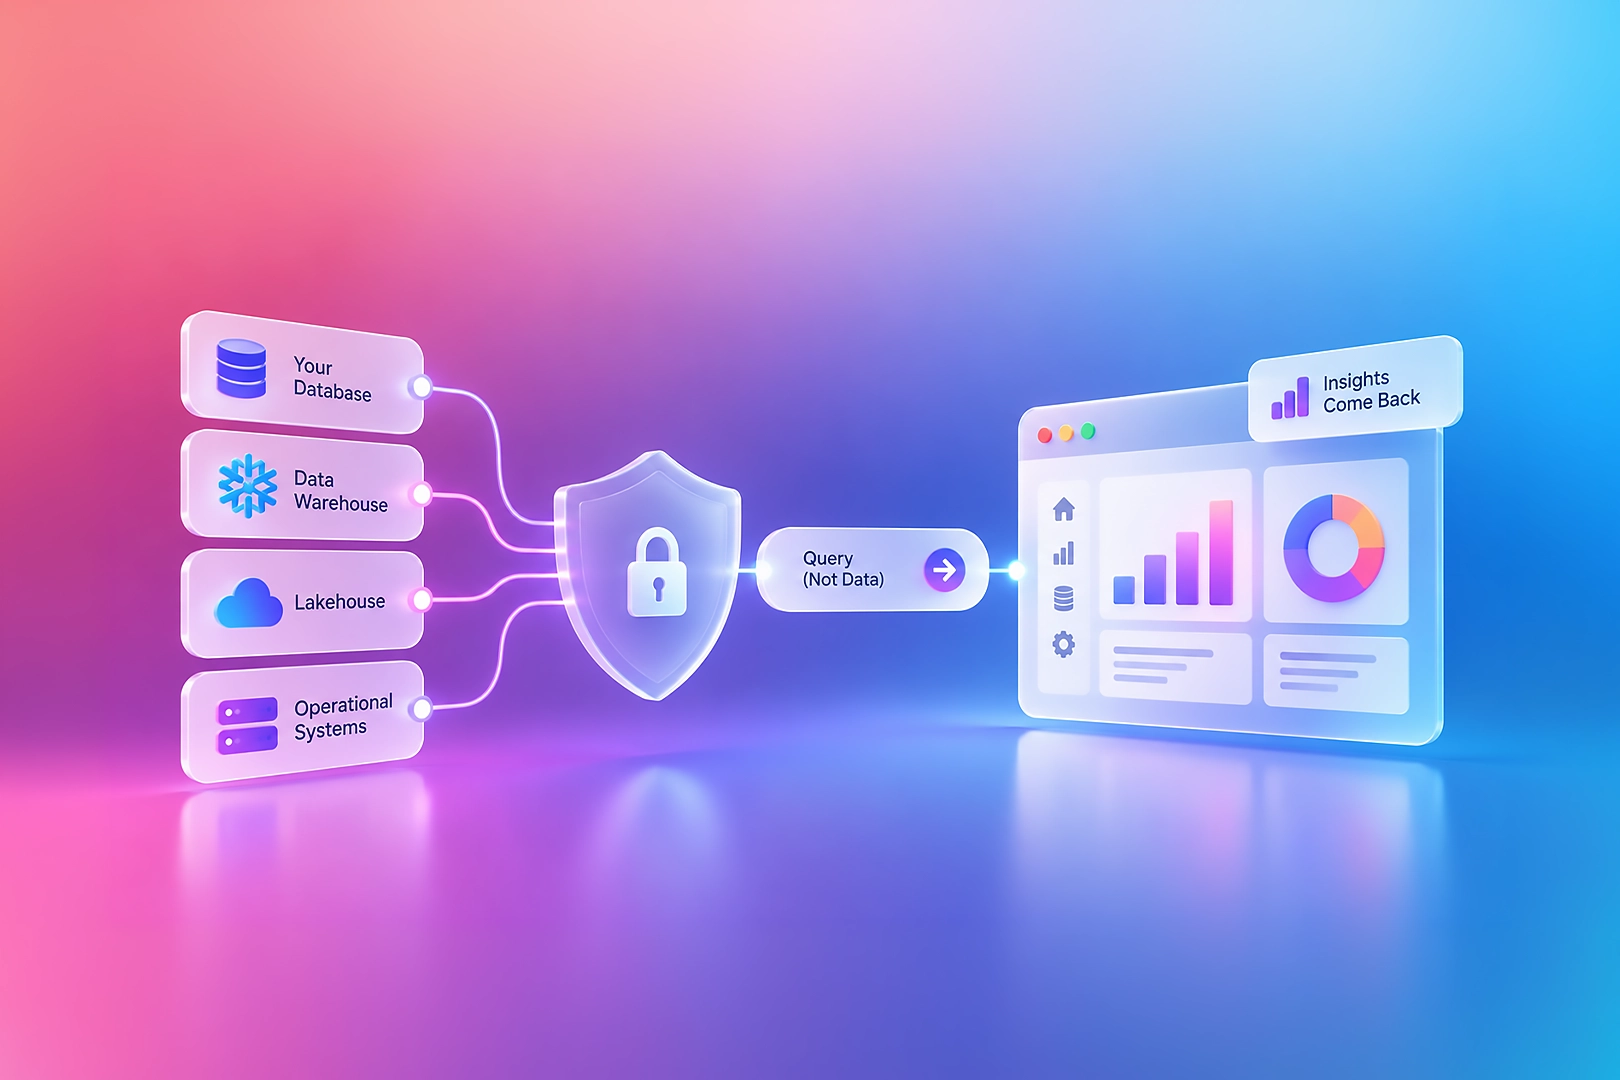
    Analytics without data movement is exactly what the name implies: you analyze data without first relocating it. Instead of the data traveling to the analytics engine, the query travels to the data. The raw records stay in their system of record; only the computed result — an aggregate, a chart, a number comes back. 

    It helps to contrast two mental models. 

    The traditional model: move data to the query. You build pipelines (ETL/ELT) that extract raw data from source systems, transform it, and load it into a separate analytics store. Your BI tool then queries that copy. The data has physically moved, often multiple times, and now exists in more than one place. 

    The query-in-place model: move the query to the data. Your analytics layer connects above the data, issues a query directly against the source (or a governed semantic layer over it), and retrieves only the result set. Raw data is read where it lives and is never persisted into a separate analytics platform. 

    The core idea in one sentence: Don’t bring the data to the question — bring the question to the data. 

    You’ll encounter several overlapping terms for this approach, and it’s worth knowing how they relate: 

    Term 
    What it emphasizes 
    Zero-copy analytics 
    No duplicate physical copy of the raw data is created 
    Query-in-place / query data in place 
    Computation happens against data in its original location 
    No data movement BIThe BI tool reads but does not relocate source data 
    Query federationA single query interface spans multiple distributed sources without consolidating themData residency analyticsAnalytics that respects where data is legally required to stay 

    These aren’t identical, but they share one governing principle: the authoritative, granular data stays put. That principle is the entire point and the source of every benefit that follows. 

    The Hidden Cost of the Traditional BI Copy Model 

    The conventional analytics stack looks reasonable on an architecture diagram. Source systems on the left, pipelines in the middle, a warehouse and BI tool on the right. Clean arrows, left to right. The problem is what those arrows actually represent: every arrow is a copy of your data crossing a boundary. 

    Consider what a single dashboard often requires under the traditional model: 

    Raw data extracted from an operational database into a staging area. 

    Transformed and loaded into a central warehouse. 

    Extracted again into the BI tool’s own engine or in-memory cache for speed. 

    Sometimes replicated into the BI vendor’s managed cloud for processing. 

    That’s potentially four locations holding row-level data, each with its own access model, encryption posture, logging, and — critically — its own breach blast radius. As industry analysts of federated architectures put it, centralizing everything “creates a larger consolidated attack surface through data duplication and movement.” 

    The costs compound across four dimensions: 

    Security. Each copy is an independent thing to secure, patch, monitor, and eventually decommission. The BI vendor’s cloud becomes, in effect, an extension of your own data perimeter — but one you don’t operate. As one zero-copy proponent bluntly notes, copying data to the analytics tier “creates yet another point of security failure.” 

    Compliance. A copy in a different region can silently breach data residency rules. And under regulations like GDPR, your deletion obligations don’t stop at the source — deletion must propagate to “backups, logs, analytics systems, and ML training data.” Every copy you made is now a copy you must prove you erased. 

    Cost. You pay to store the same data multiple times, pay to run the pipelines that move it, and pay engineers to maintain those pipelines when schemas change. 

    Freshness. Data that has to be copied is, by definition, stale between syncs. By the time it lands in the warehouse and then the BI cache, “the data is stale by the time it reaches the warehouse.” Decisions get made on yesterday’s numbers. 

    The uncomfortable summary: the traditional model treats making more copies of sensitive data as the foundation of analytics. Everything downstream the governance burden, the residency headaches, the breach exposure flows from that one starting decision. 

    What Is Level-Zero Data and Why It’s the Real Risk 

    Not all data carries equal risk. To understand why “no data movement” matters so much, you have to distinguish between the layers of an analytics stack. 

    Level-zero data is the raw, granular, row-level source of truth — individual transactions, customer records, line items, event logs. It’s the most detailed and therefore the most sensitive form your data takes. A single level-zero row might contain a named customer, their purchase, their location, and a timestamp. It is precisely the data that regulators care about and attackers want. 

    Above level zero sit the things analytics actually delivers: 

    Aggregates -“total revenue by region this quarter.” 

    Metrics and KPIs – derived numbers, often stripped of personal identifiers. 

    Visualizations – charts and dashboards that present those aggregates. 

    Here’s the crucial insight: business users almost never need level-zero data itself. They need answers derived from it. A regional sales leader asking “how did we do last quarter?” needs a number, not a download of every customer transaction. 

    Yet the traditional BI model copies all of level zero into the analytics tier just so it can compute those aggregates locally. You move the riskiest possible data every raw row  in order to produce results that contain almost none of that risk. 

    The asymmetry that defines the problem: the data that’s dangerous to move (raw level-zero rows) is rarely the data anyone actually wants to see. The data people want (aggregates and answers) is comparatively safe. Analytics without data movement exploits this asymmetry: keep the dangerous layer in source, and let only the safe layer travel. 

    This is why “keeping level-zero data in source” is not a minor technical preference. It’s a direct reduction of the single largest category of data risk in your analytics pipeline. 

    How Query-in-Place Analytics Works 

    If the data isn’t moving, how do you actually get an answer? The mechanics are more straightforward than they sound. 

    A query-in-place analytics platform sits above the data layer rather than ingesting from it. When a user asks a question, the platform: 

    Interprets the request and resolves it against a semantic understanding of where the relevant data lives which tables, which sources, which joins. 

    Generates the correct query (typically SQL) for the underlying source system. 

    Pushes that query down to the source, where the source’s own engine executes it against level-zero data in place. 

    Returns only the result set the aggregate, the rows that match, the computed metric to be rendered for the user. 

    The raw data is read and processed inside the source’s security perimeter. As one federation architecture describes it, queries are “retrieved dynamically and processed in memory without being stored locally,” and “the data never crosses the perimeter.” 

    Here’s the flow as a diagram: 

    TRADITIONAL BI (data moves) 

    ┌──────────┐   copy raw    ┌──────────┐   copy raw   ┌──────────┐ 

    │  Source  │ ─────────────▶│Warehouse │ ────────────▶│ BI Engine│ 

    │(level-0) │   rows out    │ (level-0)│   rows out   │ (level-0)│ 

    └──────────┘               └──────────┘              └────┬─────┘ 

       3+ copies of raw data, 3 attack surfaces             │ charts 

                                                              ▼ 

                                                           👤 User 

    QUERY-IN-PLACE (query moves) 

    ┌──────────┐                              ┌─────────────────────┐ 

    │  Source  │◀──── query pushed down ──────│  Analytics Layer    │ 

    │(level-0) │                              │  (sits above data)  │ 

    │  stays   │───── only results back ─────▶│                     │ 

    └──────────┘    (aggregates, not rows)    └─────────┬───────────┘ 

       1 copy of raw data, 1 attack surface             │ charts 

                                                          ▼ 

                                                       👤 User 

    A modern natural-language analytics layer adds one more capability on top: it lets users ask questions in plain English, then translates those into the correct query for the source. As Quaeris describes its own approach, an “agentic layer turns natural language into the correct query,” learning the structure of the SQL housing your data so that “if you can think of a question to ask,” the system can answer it directly against your source without that source data ever being copied to the analytics platform or its cloud. 

    The result is the best of both worlds in principle: the accessibility of self-service BI, without the data-duplication tax that normally comes with it. 

    Data Residency: The Compliance Case for Keeping Data in Source 

    Data residency is where “no data movement” stops being an architectural nicety and becomes a compliance necessity. 

    Data residency refers to the physical or geographic location where data is stored and processed. Data localization is the stricter cousin — a legal requirement that certain data must remain within a specific territory and cannot be transferred outside it at all. Both are enforced with growing seriousness: in 2025, regulators began penalizing organizations “not just for breaches but for improper data transfers or lack of proper localization strategies.” 

    Now overlay the traditional BI model on this. The moment your analytics tool copies EU customer data into a US-region processing cluster or into the vendor’s globally distributed cloud you may have created a cross-border transfer you never intended. You didn’t change your storage policy; you just connected a dashboard. But the data moved, and movement is exactly what residency law governs. 

    Query-in-place analytics sidesteps this category of problem structurally. Because raw data never leaves its source: 

    Data stays in its required jurisdiction. If your EU data is in an EU-region warehouse, queries run there and only aggregated results travel. The level-zero records never cross the border. Running live queries “maintains data residency, sovereignty, and compliance, especially across complex, distributed IT landscapes.” 

    Deletion obligations shrink. GDPR’s “right to erasure” requires deletion to propagate to every system holding the data, including analytics. If analytics never held a copy, there’s nothing extra to find, delete, and prove deleted. 

    Audit scope narrows. Fewer copies means fewer systems an auditor has to inspect to confirm where regulated data resides. 

    The financial stakes make this worth designing for. GDPR penalties reach €20 million or 4% of global turnover, enterprises report $500K+ annual costs just for handling data-subject requests, and a single complex request can consume 40–80 hours of manual work. An architecture that simply doesn’t replicate regulated data into new locations removes whole branches of that workload before it starts. 

    Compliance reframed: The cheapest data to keep compliant is the copy you never made. 

    Security Benefits: Shrinking the Attack Surface 

    Security teams have a useful instinct: the safest data is data that doesn’t exist where it doesn’t need to. Analytics without data movement is a direct application of that instinct. 

    1. A smaller attack surface. Every copy of level-zero data is a target. Eliminate the analytics-tier copy and you eliminate an entire class of breach scenario the one where attackers exfiltrate raw records from a BI cache, an export, or the vendor’s cloud rather than from your hardened source. Federated, no-movement designs “reduce the attack surface by minimizing data copying.” 

    2. Existing controls are preserved, not re-implemented. When data stays in source, your existing encryption, network controls, and access policies continue to apply unchanged. You don’t have to rebuild — and keep in sync a parallel security model inside the BI platform. As zero-copy advocates note, the approach keeps data “in its original source… while preserving existing security controls and encryption.” 

    3. Permission inheritance closes the “shadow access” gap. One of the quiet dangers of copied data is permission drift: a user who can’t see certain rows in the source system can see them in the BI tool because the copy was loaded with broader access. A true query-in-place model inherits source permissions. In Quaeris’s framing: “If a user cannot see the data in the source system, they cannot see it in Quaeris.” That single property keeps security and compliance teams confident that analytics can’t become a backdoor around source-system access controls. 

    4. Fewer credentials and pipelines to secure. Each ETL pipeline is itself an attack path it holds credentials to your source systems and writes data somewhere new. Removing the need to move data removes those pipelines and the standing credentials they require. 

    The honest counterpoint, worth stating plainly: federated and query-in-place models introduce their own complexity. Pushing queries across multiple sources means managing “multi-cloud IAM policies” and reconciling “inconsistent security policies across different sources.” No-movement isn’t free of governance work — it relocates that work to the query layer. But it relocates it to a layer you control, against data that never multiplied, which is a far better problem to own than a sprawl of unguarded copies. 

    Architecture Patterns and How to Choose 

    “No data movement” is a principle, not a single product. It shows up in several architectural patterns, and choosing well means matching the pattern to your constraints. 

    PatternHow it worksBest whenWatch out forQuery-in-place / push-downBI layer pushes queries to a single source (warehouse, lakehouse); only results returnYou’ve consolidated into one strong warehouse and want safe BI on topSource must handle analytical query loadQuery federationA virtual layer spans multiple distributed sources in one query, no consolidationData is genuinely siloed across systems/regions and can’t be mergedCross-source joins can be slow; needs governance at query layerZero-copy data sharingSource grants governed read access to a consumer without copying (e.g., warehouse-native sharing)Both sides use compatible platformsTighter platform couplingSemantic / metrics layer over sourceA governed model defines metrics; queries resolve to source at runtimeYou want consistent KPIs without a physical martModeling effort up front 

    A few decision principles cut through the options: 

    Start from your residency map. If regulated data must stay in specific regions, any pattern that copies it out is disqualified before you evaluate features. Let compliance constraints filter the field first. 

    Match the pattern to your data’s distribution. One consolidated warehouse points toward query-in-place push-down. Genuinely scattered sources point toward federation. 

    Govern at the query layer. Whatever pattern you choose, the place to enforce access, masking, and audit is the layer issuing queries — because that’s the only place all requests pass through when data itself doesn’t move. 

    Prefer permission inheritance over permission re-creation. A tool that reuses source permissions is structurally safer than one asking you to redefine who-sees-what inside the analytics platform. 

    Implementation: A Practical Migration Path 

    Moving from a copy-everything model to analytics without data movement doesn’t have to be a big-bang rewrite. A staged approach lets you prove value and de-risk as you go. 

    Step 1 – Inventory your copies. Map every place level-zero data currently lands: staging areas, the warehouse, BI caches, vendor clouds, exports, spreadsheets. You can’t reduce copies you can’t see. This inventory alone is often eye-opening for security teams. 

    Step 2 – Classify data by residency and sensitivity. Tag which datasets are regulated, which are residency-bound, and which are genuinely low-risk. This tells you where no-movement is mandatory versus merely beneficial. 

    Step 3 – Pick a high-value, high-sensitivity pilot. Choose one dashboard or use case built on sensitive data — ideally one where a stray copy would be a real compliance problem. Re-implement it query-in-place against the source. 

    Step 4 – Validate permission inheritance. Before trusting the new layer, test the critical property directly: confirm that a user restricted in the source system is equally restricted in analytics. This is the linchpin of the security argument; verify it, don’t assume it. 

    Step 5 – Measure freshness and performance. Compare query latency and data freshness against the old copied model. Push-down queries hit live data, so freshness usually improves; latency depends on source capacity, so size accordingly. 

    Step 6 – Decommission the redundant copies. Once the no-movement path is proven, retire the pipelines and caches feeding the old copy — and document the deletion for your auditors. This is where the cost and compliance savings actually land. 

    Step 7 – Expand and standardize. Roll the pattern out to additional use cases, and make “does this require moving level-zero data?” a standing question in every new analytics request. 

    Best practice: Treat each retired copy as a security win worth recording. “We eliminated three redundant copies of customer PII” is exactly the kind of sentence that resonates in a board-level risk review. 

    Real-World Scenarios 

    Multinational retailer residency by design. A retailer operates in the EU, US, and APAC, each with its own regional data store and its own localization rules. Under a traditional BI model, building a global revenue dashboard meant copying regional sales data into one central cloud a cross-border transfer nightmare. With query-in-place analytics, each regional query runs locally against in-region data; only aggregated revenue figures (which contain no personal data) are combined for the global view. Residency is preserved structurally, not policed after the fact. 

    Healthcare provider minimizing PHI exposure. Healthcare breaches are the most expensive of any sector, averaging $10.93 million. A provider wants clinical analytics without spreading protected health information into yet another system. By querying patient data in place and surfacing only de-identified aggregates to analysts, the raw PHI never enters the analytics tier shrinking both breach exposure and HIPAA audit scope. 

    Financial services permission inheritance as a control. A bank’s source systems enforce strict row-level access: a relationship manager sees only their own clients. With copied-data BI, those controls had to be painstakingly re-created in the reporting tool, and drift was a constant audit finding. With permission-inheriting query-in-place analytics, the source rules apply automatically an analyst literally cannot query rows they’re not entitled to see in the source. 

    SaaS startup analytics without a data-engineering team. An early-stage company wants self-service analytics but has no one to build and babysit ETL pipelines. A natural-language layer that queries the production warehouse in place lets non-technical staff ask questions directly, with no pipelines to maintain and no second copy of customer data to secure a meaningful reduction in both engineering load and risk surface for a small team. 

    Enterprise data mesh federation across domains. A large enterprise with a data-mesh strategy has dozens of domain-owned data products across clouds. Rather than re-centralizing them (defeating the mesh), a federated query layer spans them in place, enforcing governance at the query layer while each domain retains ownership and residency of its own level-zero data. 

    Common Mistakes to Avoid 

    Even teams sold on the concept stumble in predictable ways. Watch for these: 

    1. “Zero-copy” that quietly caches. Some tools claim no data movement but maintain a hidden extract or aggressive cache of raw rows for performance. If level-zero data is persisted anywhere outside the source, you haven’t actually eliminated the copy — you’ve just hidden it. Ask vendors precisely what is stored, where, and for how long. 

    2. Re-creating permissions instead of inheriting them. Rebuilding access rules inside the analytics tool reintroduces drift and the shadow-access risk. If the tool can’t inherit source permissions, you’ve kept one of the worst problems of the copy model. 

    3. Ignoring source query load. Push-down analytics means your source now serves analytical queries on top of its day job. Without read replicas or adequate capacity, you can degrade the very system of record you were protecting. Plan for the load. 

    4. Treating federation as free. Cross-source federated joins can be slow and can expose inconsistent security policies between systems. No-movement reduces copy risk but demands real governance discipline at the query layer. Don’t mistake “no copies” for “no work.” 

    5. Forgetting result-set sensitivity. Aggregates are usually safe but not always. A filtered result that returns a single row can be as identifying as raw data. Apply masking and minimum-aggregation thresholds at the query layer, not just at the storage layer. 

    6. Skipping the deletion-of-old-copies step. Teams adopt query-in-place for new dashboards but never decommission the legacy pipelines and caches. You only realize the security and compliance benefit when the redundant copies are actually gone. 

    Advanced Insights and Future-Proofing 

    Analytics is converging with AI and AI raises the stakes on copies. As organizations feed data into LLMs and AI agents, the “where did the raw data go?” question gets sharper, because AI systems are notorious copy-multipliers (training sets, embeddings, vector stores, logs). The same principle applies and matters more: let the AI query layer reason against governed source data in place rather than vacuuming level-zero records into yet another store. Natural-language analytics that generates queries against the source rather than ingesting the source is a preview of how AI and data residency can coexist. 

    Make “no new copy” an architectural default, not an exception. The most future-proof posture is to invert the old assumption. Instead of “copy data into analytics unless there’s a reason not to,” adopt “never copy level-zero data unless there’s a compelling, documented reason to.” This single default change cascades into simpler compliance, smaller attack surface, and lower cost across every future project. 

    Govern the query layer like you’d govern a database. When data stops moving, the query layer becomes the chokepoint where all access, masking, and audit must live. Invest there: centralized policy, full query logging, and consistent enforcement across every source. The payoff is that you get one place to govern instead of N copies to chase. 

    Watch the regulatory trajectory. Data localization rules are tightening, not loosening the count of regional regulations keeps climbing. Architectures that assume free cross-border data movement are accumulating technical and legal debt. No-movement analytics is a hedge against a regulatory future that is clearly heading toward more restriction on where data can go. 

    Strategic takeaway: The organizations that will move fastest under tightening regulation are the ones that designed their analytics to not move data in the first place. Constraint becomes an advantage when you’ve built for it. 

    Frequently Asked Questions 

    What is analytics without data movement? 

    It’s an analytics architecture where the BI or AI layer queries data in its original source system instead of copying raw records into a separate analytics platform. The query travels to the data; only the computed result (an aggregate or answer) comes back. Raw, level-zero data never leaves the source. 

    What does “level-zero data” mean? 

    Level-zero data is the raw, granular, row-level source of truth individual transactions, customer records, event logs. It’s the most detailed and most sensitive form of your data. Most analytics consumers need aggregates derived from it, not the level-zero rows themselves, which is why keeping that layer in source dramatically reduces risk without limiting insight. 

    How is this different from a traditional data warehouse setup? 

    A traditional setup copies raw data through pipelines into a warehouse, and often again into a BI tool’s own engine or cloud — creating multiple copies and multiple attack surfaces. Query-in-place analytics reads data where it lives and returns only results, so no additional copy of level-zero data is created. 

    Is “zero-copy analytics” the same as “no data movement BI”? 

    They’re closely related and often used interchangeably. Both describe analyzing data without creating a duplicate physical copy of the raw data. “Query federation” is a specific flavor that spans multiple distributed sources in a single query without consolidating them. 

    Does keeping data in source make analytics slower? 

    Not necessarily. Push-down queries run on live data, so freshness usually improves over copied models. Latency depends on the source’s capacity to serve analytical queries — which you can address with read replicas or appropriate sizing. The key trade-off is provisioning source compute, not accepting stale data. 

    How does query-in-place analytics help with data residency and GDPR? 

    Because raw data never leaves its source region, you avoid unintended cross-border transfers, and regulated data stays in its required jurisdiction. It also shrinks GDPR deletion obligations — there’s no extra analytics copy to find and erase — and narrows audit scope to the systems that actually hold the data. 

    What is permission inheritance and why does it matter? 

    Permission inheritance means analytics honors the source system’s access rules: if a user can’t see certain rows in the source, they can’t see them in analytics either. It prevents the “shadow access” problem where a copied dataset exposes data the user was never authorized to see, and it removes the need to rebuild and sync a parallel permission model. 

    Does no data movement reduce my security risk? 

    Yes, structurally. Eliminating the analytics-tier copy removes an entire class of breach scenario and preserves your existing encryption and access controls instead of forcing you to re-implement them. It does shift governance work to the query layer, so you must secure that layer well but you’re governing one controlled chokepoint instead of multiple uncontrolled copies. 

    Can I query data across multiple systems without moving it? 

    Yes that’s query federation. A federated query layer issues a single query across multiple distributed sources (different databases, clouds, or regions) and combines results without consolidating the underlying data. It’s ideal when data is genuinely siloed and can’t or shouldn’t be merged. 

    What are the downsides of analytics without data movement? 

    The main trade-offs are managing query load on source systems, handling cross-source query performance in federated setups, and reconciling security policies across different sources at the query layer. These are real but manageable and generally preferable to maintaining and securing many redundant copies of sensitive data. 

    How do I evaluate a BI or analytics vendor for this? 

    Ask one anchoring question: Does connecting you create a copy of my raw data, and if so, where does it live? Then probe specifics does it cache or extract level-zero data, does it inherit source permissions, can it keep data in-region, and what exactly is stored in the vendor’s cloud. The answers reveal whether “no data movement” is real or marketing. 

    Is this approach suitable for AI and natural-language analytics? 

    Yes, and it’s arguably more important there. Natural-language and agentic analytics can translate plain-English questions into queries that run against governed source data in place delivering self-service insight without vacuuming raw records into new stores, embeddings, or logs that multiply your exposure. 

    Conclusion 

    For most of BI’s history, “move the data first” was an unquestioned default. Fast analytics seemed to require local copies, and local copies required movement. But that default was quietly expensive — it multiplied attack surfaces, complicated residency compliance, inflated storage and pipeline costs, and served users stale numbers. 

    Analytics without data movement inverts the default. By sending the query to the data instead of the data to the query, you keep level-zero data — the raw, sensitive source of truth — exactly where it already lives, governed by controls you already trust. Users still get their dashboards and answers; what they don’t get is a redundant copy of your most sensitive data sitting in a system you don’t fully control. 

    The benefits stack cleanly: 

    Security: a smaller attack surface, preserved encryption and access controls, and permission inheritance that closes the shadow-access gap. 

    Compliance: structural data residency, smaller deletion obligations, and narrower audit scope. 

    Cost and freshness: fewer copies to store, fewer pipelines to maintain, and live data instead of stale extracts. 

    Recommended next steps: inventory where your level-zero data is being copied today, classify it by residency and sensitivity, and re-implement one high-sensitivity dashboard query-in-place as a pilot validating, above all, that source permissions carry through. Then make “does this require moving level-zero data?” a standing question for every new analytics request. 

    The outlook: as data localization rules tighten and AI multiplies the temptation to copy data everywhere, architectures that simply don’t move sensitive data will hold up best. The cheapest data to secure, and to keep compliant, is the copy you never made. Build your analytics so you never have to make it. 
  • The 5 AI agent platforms to look out for in 2026

    The 5 AI agent platforms to look out for in 2026

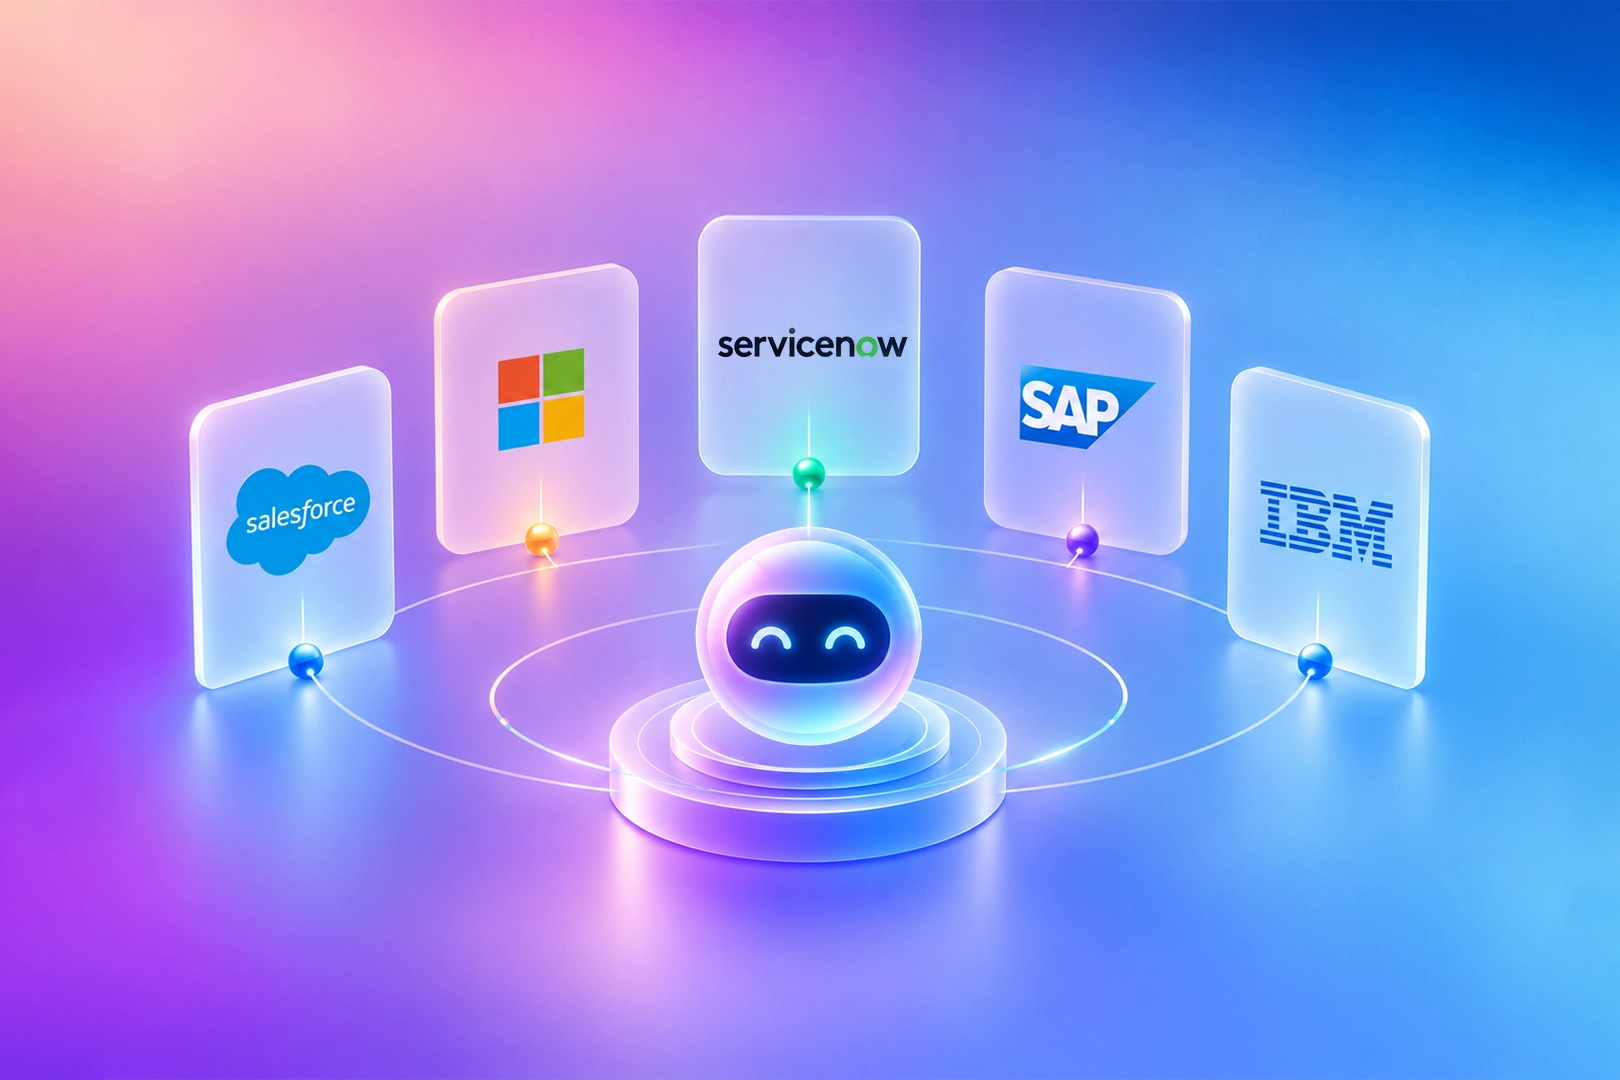
    Enterprise agentic AI moved from pilot budgets to production commitments faster than most other categories of enterprise software. That speed created a side effect worth naming upfront: one industry guide to this exact topic calls out “agent washing,” vendors relabeling existing chatbots, RPA scripts, or linear workflow tools as agents without the underlying system actually doing autonomous, multi-step reasoning. The same guide argues genuine agentic AI requires autonomous decision-making, multi-step reasoning, and dynamic error handling, and that most products marketed this way do not clear that bar.

    With that caveat in mind, five platforms show up consistently across independent comparison sources (not just their own marketing) as the ones enterprise teams are actually deploying in production. This list is organized by the enterprise system each one is built around, since that is the factor most buyer’s guides agree should drive the decision.

    1. Salesforce Agentforce

    Agentforce is Salesforce’s agent platform, built to operate directly on Salesforce’s own data model so agents work against current CRM records without a separate synchronization layer. Governance runs through Salesforce’s Einstein Trust Layer and existing audit logs, and MuleSoft extends its reach into other systems. As of independent 2026 coverage, Salesforce has closed roughly 29,000 Agentforce deals since launch, generating around $800 million in annual recurring revenue, figures reported externally rather than only claimed by Salesforce itself.

    Best for: organizations already running Salesforce as their primary CRM who want agents acting on live customer data without a new integration layer.

    2. Microsoft Copilot Studio

    Copilot Studio is Microsoft’s low-code agent builder, with independent 2026 reporting citing roughly 160,000 organizations running more than 400,000 custom agents on the platform. Its core strength is depth of integration across the Microsoft ecosystem, Microsoft 365, Dynamics, and Azure, making it the practical default for organizations already standardized on Microsoft’s stack. Comparison guides consistently note it alongside Agentforce as one of the two platforms with the fastest time to production for pre-built use cases, typically four to six weeks.

    Best for: Microsoft-centric organizations that want agent building accessible to business users, not only engineering teams.

    3. ServiceNow AI Agents

    ServiceNow’s agent capabilities sit inside its existing IT service management, HR, and customer service management workflows, under the Now Assist feature set. In April 2026, ServiceNow restructured its commercial model to embed an AI Control Tower and Workflow Data Fabric across every pricing tier by default rather than as an add-on, a move independent coverage described as a signal that governance-first architecture is becoming a baseline market expectation, not a premium feature. ServiceNow also acquired Moveworks in late 2025, which now operates under the ServiceNow umbrella and extends its employee-facing agent capabilities across Slack and Microsoft Teams with more than 100 pre-built integrations.

    Best for: large enterprises already running ServiceNow for IT service management that want to extend agent-driven support into HR and broader employee operations.

    4. SAP Joule Studio

    SAP’s agent platform evolved substantially through 2026. Joule Studio, a full agent builder on SAP’s Business Technology Platform, reached general availability in Q1 2026, and Joule Studio 2.0 followed at SAP Sapphire in May 2026 with a fully managed, zero-infrastructure version aimed at citizen developers rather than only professional coders, backed by a 100 million euro partner fund. SAP describes agents built this way as natively grounded in a business’s existing SAP data, processes, and semantics rather than connected to them afterward. Reported agent and skill counts vary by source and by which specific SAP AI product is being described, ranging from roughly 40 specialized agents and 2,400 skills in one 2026 analysis to 200 domain-specific agents announced with Joule Studio 2.0, so treat any single number as a snapshot rather than a fixed figure, and confirm current scope directly with SAP.

    Best for: enterprises running SAP as their core ERP that want agents grounded in existing SAP business processes without a separate integration project.

    5. IBM watsonx Orchestrate

    watsonx Orchestrate positions itself as a governance-first control plane rather than a single-vendor agent builder, with a stated skills catalog of more than 150 pre-built automations and integrations spanning SAP, Salesforce, and ServiceNow. Independent buyer’s guides consistently rate its governance and auditability as the strongest in this category, describing it as built for large, regulated enterprises where explainability is not optional, with the tradeoff that deployment cycles tend to run longer than SaaS-native competitors due to procurement rigor. IBM also released an Agent Management Platform in March 2026, a vendor-agnostic governance layer that can manage agents across other frameworks and vendors, including LangGraph, CrewAI, Google’s Agent Development Kit, AWS AgentCore, Microsoft Foundry, and Salesforce Agentforce, from a single control plane.

    Best for: regulated enterprises running multiple AI agent vendors or frameworks that need one governance layer over all of them, not just IBM’s own agents.

    The pattern worth noticing

    Every platform on this list leads with governance and grounding in existing business systems, not raw agent capability alone. That is not a coincidence. Gartner’s own 2026 Analytics and BI Magic Quadrant made a related point for the adjacent BI category: success increasingly depends on more than a large language model, it requires governed business context and the ability to operationalize decisions inside existing workflows. The same logic applies here. An agent that reasons well but cannot prove what it touched, why, and under whose permission is a harder sell in an enterprise than a system that is somewhat less flashy but fully auditable.

  • The four pillars of Governed Agentic Analytics: audit, semantic, agentic, BYOM

    The four pillars of Governed Agentic Analytics: audit, semantic, agentic, BYOM

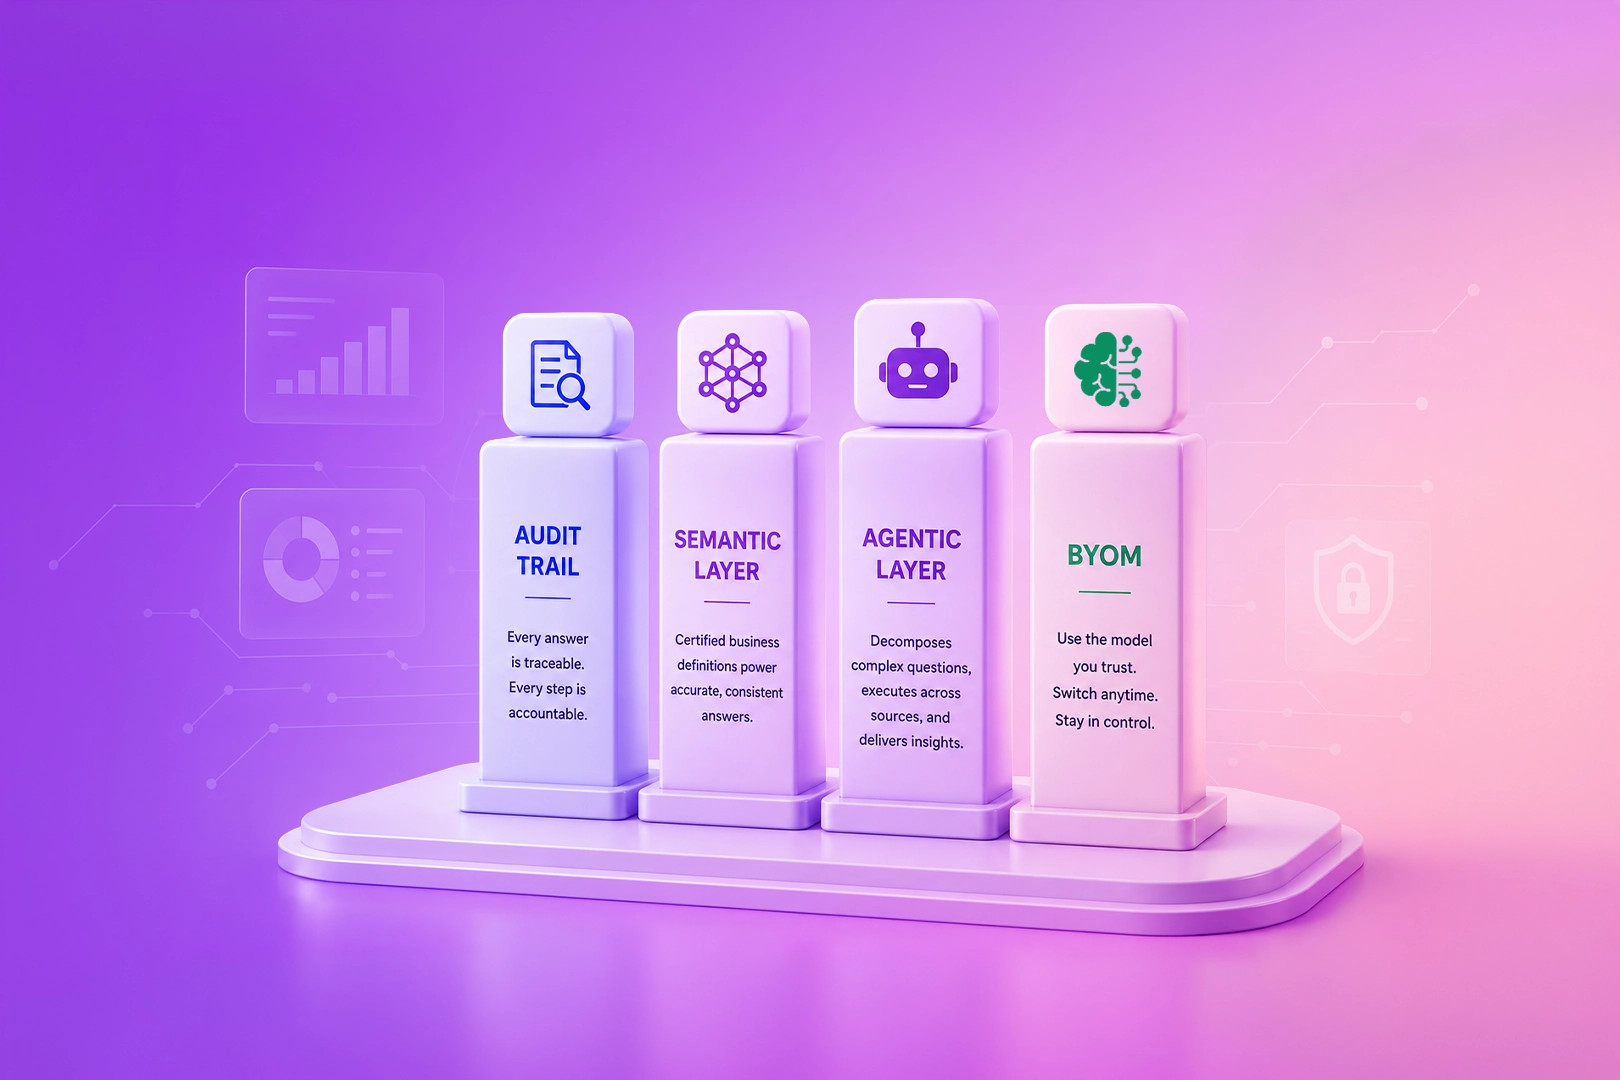
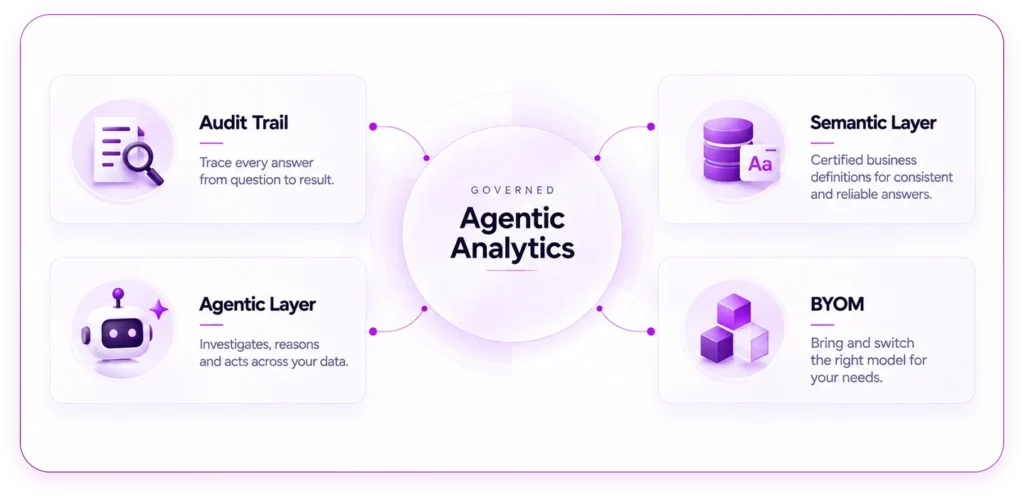
    Four capabilities separate a governed agentic platform from a chatbot bolted onto a warehouse. Remove any one of them and the structure fails in a specific, predictable way. This piece defines each pillar, explains what breaks without it, and shows how the four reinforce one another when they are built as one system rather than assembled from separate tools.

    Pillar one: the audit trail

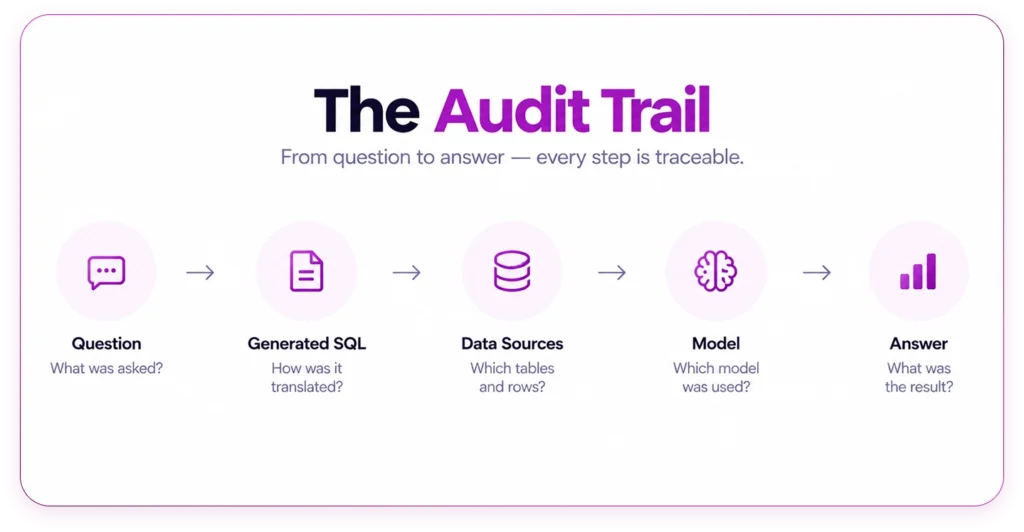
    Every question asked of an agent should produce two artefacts: the answer, and the record of how the answer was produced. The audit pillar means logging the full chain on every interaction: who asked, what they asked, which SQL the agent generated, which tables and rows it touched, which model produced the reasoning, and what came back. This is the prompt-level audit trail, and it is the difference between an answer you can act on and an answer you can defend.

    Without it, every agent response is an orphan. When a number in a board deck is challenged three months later, there is no way to reconstruct where it came from. Internal audit cannot test the system. Regulators in banking, insurance, and healthcare cannot accept its outputs as evidence. The absence of an audit trail does not make an agent less useful day to day. It makes the agent indefensible on exactly the day it matters most.

    Pillar two: the semantic layer

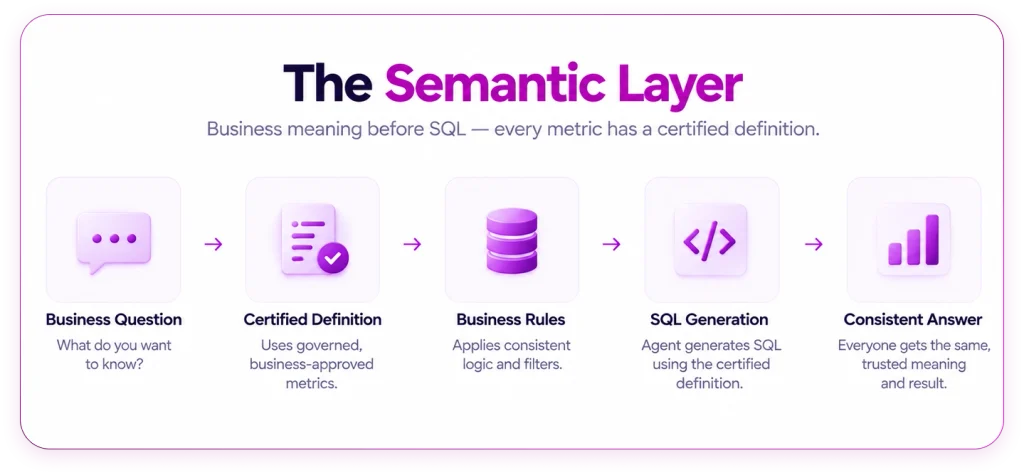
    An agent is only as accurate as its understanding of what the business means by its own words. The semantic pillar supplies that understanding: certified definitions of metrics, dimensions, and business terms that the agent consults before it writes a line of SQL. When someone asks about net revenue, the agent does not guess which of the fourteen revenue-adjacent columns in the warehouse to use. It uses the one the business certified.

    QuaerisAI’s Smart Semantic Layer adds a property that distinguishes it from manually authored alternatives: it learns. When an analyst corrects a definition or refines a query, the correction feeds back into the layer, so the next person asking a similar question benefits from it. Without a semantic layer of some kind, an agent hallucinates business logic, and it does so fluently, which is worse than failing loudly. Confidently wrong answers are the fastest way to destroy trust in an analytics deployment.

    Pillar three: the agentic layer

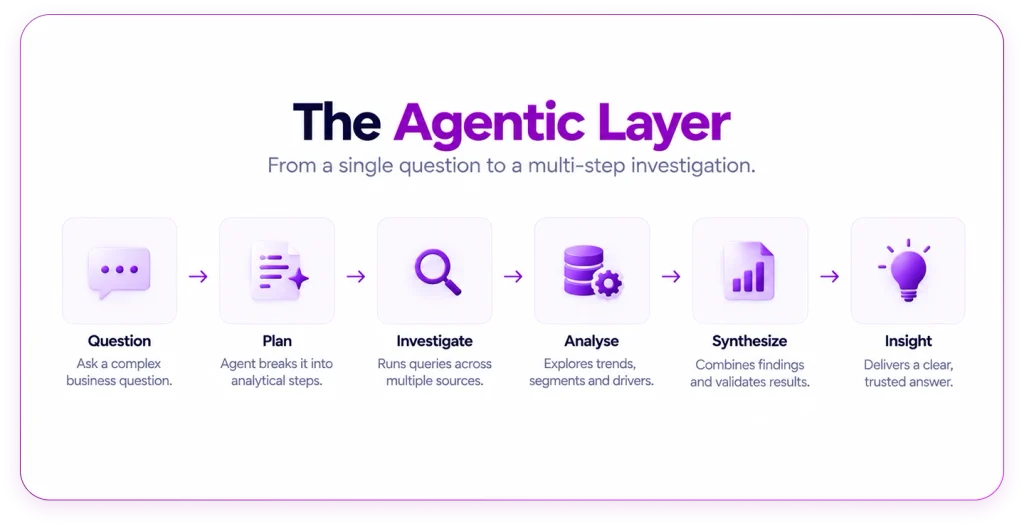
    The agentic pillar is what makes the platform more than search. Real analytical questions are rarely answered by one query. Why did margin dip in the northeast last quarter is a plan: pull the margin trend, decompose it by product line, check input costs, compare against the same period last year, and assemble a finding. The agentic layer is the capability to decompose a question into steps, execute them across structured and unstructured sources, and synthesise a result, autonomously.

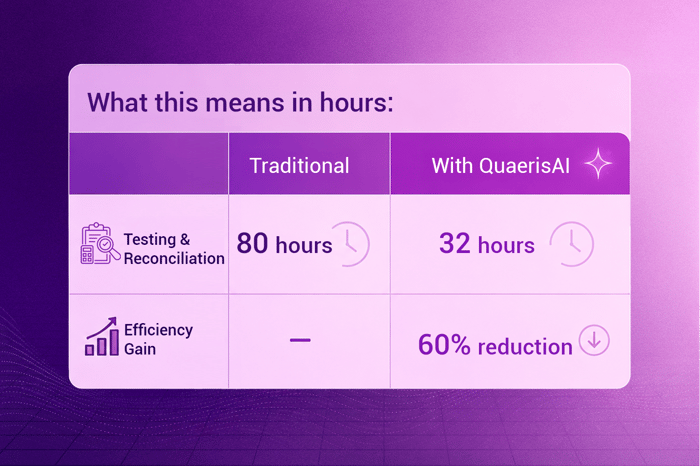
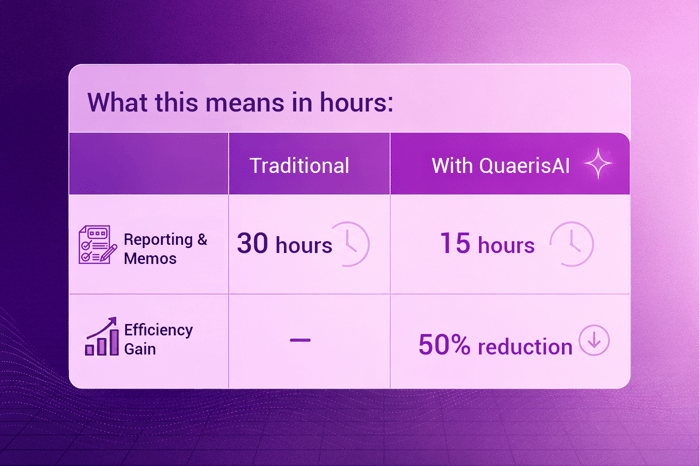
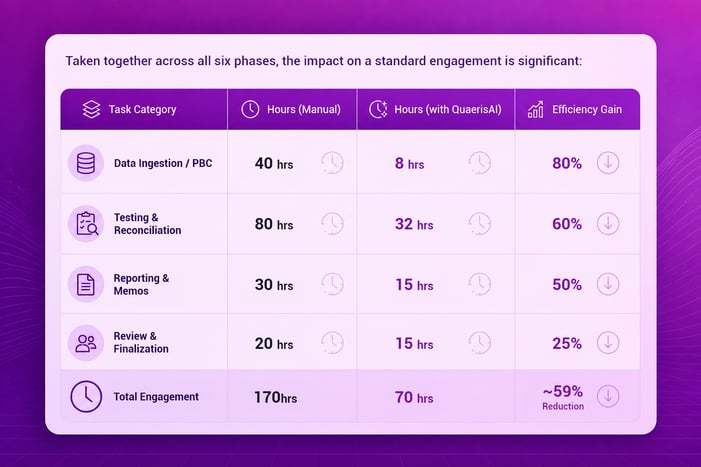
    Without it, the platform is a text-to-SQL translator: useful for single-shot lookups, incapable of investigation. The user gets a number when they needed an explanation. The distinction matters commercially because the investigation work is where the senior-staff hours actually go. Based on QuaerisAI customer deployments and published materials, agentic deployment in audit engagements has reduced standard engagement time from 170 hours to 70 hours, a 59 percent reduction, precisely because the multi-step work is where the time was.

    Pillar four: BYOM

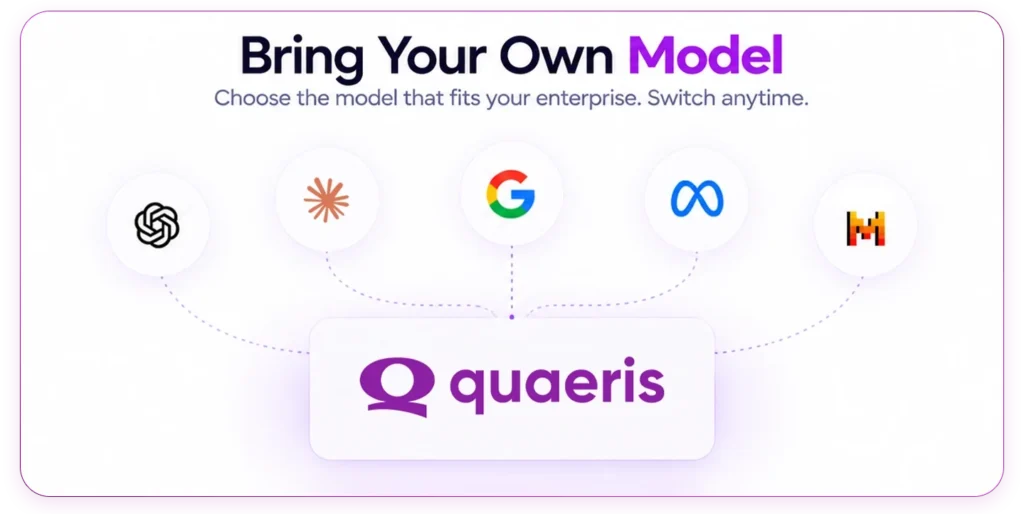
    Bring your own model means the platform runs on the language model the enterprise chooses, whether from Anthropic, OpenAI, Google, or Meta, rather than binding the customer to a single vendor’s model. This pillar looks like a procurement detail until the first time it is tested. A compliance team mandates a specific model for data-residency reasons. A model vendor changes pricing. A new model release outperforms the incumbent on SQL generation. In a BYOM architecture, each of these is a configuration decision. In a locked architecture, each is a re-platforming project.

    BYOM also changes the negotiating position. An enterprise that can switch models holds pricing power an enterprise that cannot switch has surrendered. And for regulated buyers, model choice is increasingly a compliance requirement in its own right, because model provenance is becoming part of what auditors and regulators expect organisations to document.

    Why the pillars only work together

    The four pillars are not a feature list. They are load-bearing in combination. The audit trail is only meaningful if the semantic layer makes answers deterministic enough to be worth auditing. The semantic layer only pays for itself when an agentic layer is asking it thousands of questions a day. The agentic layer is only deployable in the enterprise because the audit trail makes its autonomy accountable. And BYOM keeps the whole structure durable as the model market shifts underneath it.

    This is why assembling the equivalent from point solutions rarely works. A logging tool, a metrics store, an agent framework, and a model gateway from four vendors produce four integration seams, and governance fails at seams. Governed Agentic Analytics is one architecture, and the four pillars are its definition.

    Frequently asked questions

    Which pillar should an evaluation test first?

    The audit trail, because it is the hardest to retrofit and the easiest to verify in a demo. Ask the vendor to show the complete record for a single query: the prompt, the generated SQL, the tables touched, the model used, and the result. If that record does not exist or requires engineering effort to produce, the other three pillars are standing on sand.

    Is a semantic layer still necessary if the model is very capable?

    Yes. Model capability improves general reasoning, but no model can know that your finance team excludes intercompany transfers from net revenue, or that fiscal Q1 starts in February. Those are facts about your business, not facts about the world, and they have to be supplied by a governed definition layer. Stronger models make the semantic layer more valuable, not less, because they execute certified definitions more reliably.

    Does BYOM mean the customer manages model infrastructure?

    No. BYOM in the QuaerisAI architecture means the customer selects which model powers the platform, from providers including Anthropic, OpenAI, Google, and Meta, and can change that selection. The platform handles the integration. The customer holds the choice.

  • The Audit Industry Is Facing a Breaking Point. Agentic AI is the Fix.

    The Audit Industry Is Facing a Breaking Point. Agentic AI is the Fix.

    Here is the uncomfortable reality facing accounting firms in 2026: the accounting workforce has shrunk by over 17% since 2020, regulatory scrutiny is intensifying, and clients expect more, faster, for the same fee. The traditional audit model, built on sampling, manual document matching, and hours of workpaper writing, was never designed to absorb this pressure.

    QuaerisAI is built for exactly this shift. Not as another analytics dashboard that auditors need to learn. Not as a generic AI assistant that guesses at financial figures. But as a purpose-built Agentic Audit Intelligence platform that fundamentally changes the economics, quality, and scalability of the modern audit engagement.

    Here is what that change looks like, phase by phase, number by number.

    The Architecture Behind the Advantage

    Before diving into specific use cases, it is worth understanding what makes QuaerisAI different from the standard AI tools being applied to audit workflows. Three components work together.

    The Agentic Layer. Instead of waiting for an auditor to ask a question, QuaerisAI’s agents act autonomously. They go find data, flag anomalies, test populations, and draft documentation without a human having to trigger each step.

    The Semantic and Context Layer. A single, vetted source of truth for all audit logic and business definitions. When QuaerisAI says “Gross Contribution Margin,” it is using the exact calculation the firm has defined, not an LLM approximation. This eliminates the hallucination risk that makes generic AI tools unusable in a regulatory context. The Semantic Layer captures your business definitions and those of your clients, standardised across the organisation.

    Converged Search. A unified interface that links structured data (ERP systems, ledger entries, databases) with unstructured evidence (PDF contracts, invoices, bank statements). Auditors can query both simultaneously, in their own words.

    Together, these three capabilities change each phase of an audit engagement.

    Phase 1: Data Intake and PBC Collection – Stop Chasing, Start Reviewing

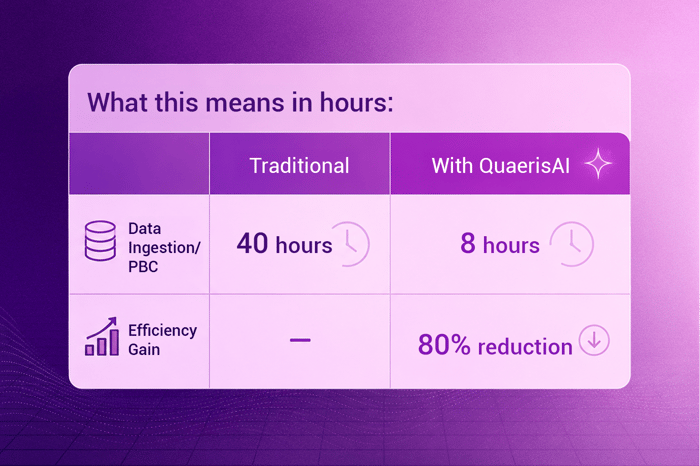
    The traditional pain: Every audit begins with a Prepared By Client (PBC) list, a manual request for documents that kicks off weeks of follow-up emails, missing files, version conflicts, and administrative back and forth. For most firms, this phase alone consumes 20% of total engagement hours.

    The QuaerisAI approach: Automated PBC Agents connect directly to the client’s data lakes and systems, retrieving and verifying evidence autonomously, without waiting for the client to send it.

    The auditor stops being a document chaser. They become a document reviewer.

    Audit Industry Blog

    An 80% reduction in administrative follow-up time, on a phase that typically consumes 40 hours per engagement, frees senior staff for the judgment-intensive work that actually requires their expertise.

    Phase 2: Transaction Testing – From Sampling to 100% Population Coverage

    The traditional pain: The cornerstone of traditional audit testing is statistical sampling. Test 50 to 100 transactions. Assume the rest are fine. Hope nothing significant hides outside the sample. This approach was a practical necessity, not a methodology preference. It was the only option when testing every transaction required human eyes on every document.

    The QuaerisAI approach: Autonomous agents scan every single transaction in the population for anomalies. Not a sample. Every transaction. Agents use Self-Generating SQL to accelerate the investigation of outliers, without requiring an IT expert or SQL-fluent auditor to write a single query.

    This is not just a speed improvement. It is a coverage transformation. Audit risk does not hide in the sample. It hides in what the sample misses.

    Phase 3: Evidence Vouching — Linking the Ledger to the Document


    Audit Industry Blog2

    The traditional pain: One of the most labour-intensive tasks in any audit is vouching, manually matching ledger entries to their underlying evidence: PDF invoices, contracts, purchase orders, bank statements. A senior associate sitting at a desk, cross-referencing document against document, for hours.

    Humans get fatigued at hour 10 of vouching. Agents do not.

    The QuaerisAI approach: Converged Search agents automatically link structured ERP data to unstructured document evidence. Using NLP and OCR integration, QuaerisAI can read contracts to confirm whether revenue recognition matches the terms actually written in the fine print. The system flags the 5% that do not reconcile. The auditor reviews those, not the 95% that are correct.

    “Show me all intercompany transfers that lack a signed agreement.”

    That question, asked directly to QuaerisAI, replaces hours of manual cross-referencing. No SQL. No dashboard navigation. No training required.

    Phase 4: Control Monitoring From Annual Checks to Continuous Assurance

    The traditional pain: Internal controls are typically assessed at a point in time, once a year, or once a quarter. In a business environment that changes weekly, this creates a structural blind spot. Policy drift, new transaction patterns, emerging anomalies; these can live undiscovered for months between assessments.

    The QuaerisAI approach: Real-time Continuous Assurance monitoring flags policy drift the moment it happens. Rather than discovering a control failure during the annual assessment, firms and their clients know about it in real time.

    The Semantic Layer is the key enabler here. Because all audit logic is defined in one vetted source of truth, monitoring rules are applied with 100% consistency, not interpreted differently by different staff members across different engagements.

    This capability moves audit from a retrospective compliance exercise to a forward-looking risk management function, a shift that many audit firm clients are actively seeking.

    Phase 5: Workpaper Documentation – From Writing to Reviewing

    The traditional pain: Auditors spend approximately 40% of their time on documentation, drafting workpapers, writing memos to explain testing methodology, citing evidence, summarising conclusions. This is not trivial work, but it is also not the work that requires a credentialled auditor’s highest-order judgment.

    The QuaerisAI approach: Narrative Agents automatically draft the Memo to File, explaining testing logic, documenting the reasoning path, and citing the evidence used. The auditor’s role shifts from writing the first draft from scratch to reviewing and signing off on a draft that has already been generated.

    Auditors ask for the summary in conversational language and receive a professional first draft.

    Audit Industry Blog3

    Phase 6: Risk Assessment – From Gut Feel to Predictive Intelligence

    The traditional pain: Audit risk assessment has historically been driven by two things: the prior year’s workpapers and the senior partner’s intuition. Both are useful. Neither is sufficient in a business environment defined by rapid change, new transaction structures, and sophisticated financial engineering.

    The QuaerisAI approach: Predictive Risk Mapping analyses current-year trends to suggest high-risk focal points before the audit begins. The Agentic Reasoning capability connects disparate data points to surface non-obvious fraud patterns, the kind that do not appear in a single anomalous transaction but emerge only when multiple signals are correlated across systems.

    This is where AI delivers differentiated value beyond efficiency. Not just doing the existing workflow faster, but identifying risks that the existing workflow would never have caught.

    Audit Industry Blog4

    For a typical mid-sized engagement that runs 200 hours, QuaerisAI realistically reclaims 80 to 100 hours. That is not an incremental efficiency improvement. That is a fundamentally different engagement economics model.

    Why This Is Different From Standard AI Tools

    The accounting profession has seen a wave of AI tools marketed at audit teams. Most of them share the same fundamental weakness: they are general-purpose language models applied to a specialised domain without the guardrails that domain requires.

    QuaerisAI addresses this directly in three ways.

    Trust via the Semantic Layer. Unlike standard LLMs that can generate a plausible-sounding answer that is factually wrong, QuaerisAI’s Semantic Knowledge Graph ensures the system only uses vetted, audited business logic. Every metric, every calculation, every definition has been defined and approved by the firm. The system cannot improvise.

    Zero-Dashboard Efficiency. Adopting a new analytics platform in an audit environment typically requires weeks of staff training and change management. QuaerisAI eliminates this friction entirely. Auditors do not learn new software. They ask questions and receive answers. Training time approaches zero.

    Solves the Talent Crisis Directly. With the accounting workforce down over 17% since 2020, firms are being asked to do more with fewer people. QuaerisAI acts as a Digital Associate, handling the grunt work of vouching, reconciliation, and documentation so that senior auditors can focus on the high-level judgment that actually requires their expertise and credential.

    The ROI for Audit Partners: Four Numbers That Matter

    For firm partners evaluating this investment, the financial case comes down to four dynamics.

    1. Increased Capacity. A single Senior Associate, supported by QuaerisAI Agents, can now effectively oversee 3 to 4 engagements simultaneously rather than 1 to 2. This multiplies revenue capacity without proportionally increasing headcount costs.

    2. Margin Protection. In a fixed-fee audit environment, which is the dominant pricing model for most mid-market engagements, every hour saved drops directly to the firm’s bottom line. A 59% reduction in engagement hours on a fixed fee is not an efficiency metric. It is a margin metric.

    3. Burnout and Retention. Junior staff attrition is one of the most expensive operational problems accounting firms face today. The leading driver is well-documented: the disproportionate burden of low-value work, data entry, manual vouching, document chasing, in the early years of a career. By removing this work from the workflow, firms can meaningfully improve the experience for junior staff and reduce the attrition that is driving the talent shortage.

    4. Error Reduction and PCAOB Risk. Manual vouching at scale is vulnerable to human fatigue. Auditors get tired at hour 10 of matching invoices to ledger entries. Agents do not. This reduces both the risk of audit failure and the risk of a PCAOB deficiency finding, reputational and regulatory risks that no firm can afford.

    The Shift That Is Already Happening

    The audit profession is not waiting for AI to mature. The firms pulling ahead are deploying it now, using the talent shortage and regulatory pressure not as reasons to delay, but as the business case to accelerate.

    The transition from “Manual and Sample-Based” to “Agentic and Continuous” auditing is not a five-year horizon. It is happening in 2026. The question is whether your firm is building the capability advantage now, or watching competitors do it first.

    See QuaerisAI in Action on Your Audit Workflows

    QuaerisAI integrates with the data systems your clients already use, connecting to ERP platforms, data lakes, document repositories, and financial systems without moving or duplicating source data. Deployment is measured in days, not quarters. Because there is no dashboard to learn, adoption starts immediately.

    What you can do from day one:

    • Automate PBC collection and evidence retrieval directly from client systems
    • Run 100% population testing instead of statistical samples
    • Vouch structured ERP data against unstructured PDF evidence simultaneously
    • Monitor controls in real time and receive alerts the moment policy drift occurs
    • Generate first-draft workpapers and memos automatically from completed testing
    • Conduct predictive risk mapping before the engagement begins

    Ready to reclaim 80 to 100 hours per engagement?

    Start Your Free Trial or book a personalised demo to see QuaerisAI working through a real audit workflow in under 30 minutes.

    QuaerisAI is an Agentic AI platform purpose-built for data-intensive industries. Its Agentic Layer, Semantic Layer, and Converged Search architecture is trusted by audit, finance, insurance, banking, and SaaS teams to activate intelligence across structured data and unstructured documents — with enterprise-grade security and zero hallucination risk