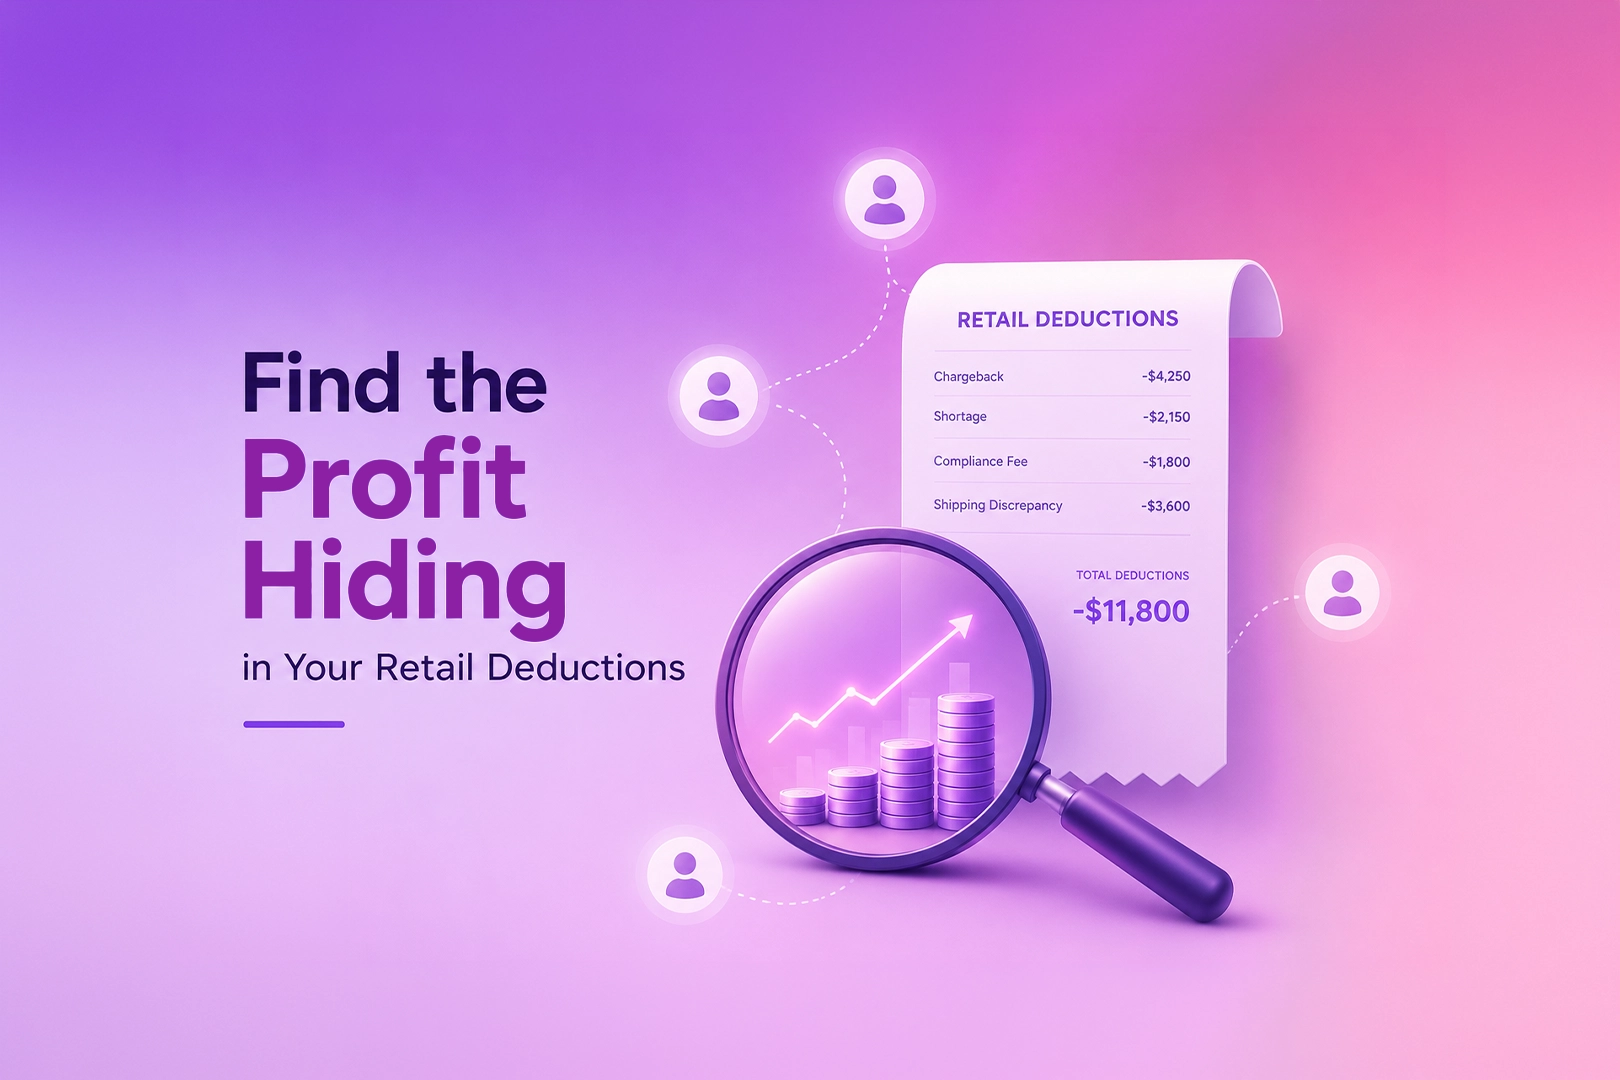
Retail deductions and chargebacks are one of the most persistent sources of profit leakage for CPG manufacturers, and one of the least visible. When a retailer issues a deduction, whether for a compliance issue, a shortage, or a shipping discrepancy, they simply reduce the payment on the invoice. The supplier receives less money and is left to determine why.
For most organisations, this creates a compounding problem. Deductions accumulate across multiple retailer relationships simultaneously. The process required to reconcile and dispute them is manual, documentation-dependent, and spread across teams that were not designed to work together. Accounts Receivable teams spend significant time searching for evidence and coordinating across logistics, warehouse, and finance just to determine whether a single deduction is valid. By the time that determination is made, the dispute window has often closed.
From Reactive Reconciliation to Proactive Profit Protection
The traditional approach to deduction management treats it as an accounting problem. Finance teams reconcile what happened, dispute what they can prove, and write off the rest. This cycle repeats every period without addressing the operational conditions that created the deductions in the first place.
QuaerisAI helps finance teams break out of this cycle by connecting deduction data to the operational supply chain signals that sit behind it. Instead of reconciling in isolation, teams can surface the underlying causes of revenue leakage and quantify the financial impact of each failure point.
This gives leadership the visibility to make decisions that actually reduce margin erosion rather than just documenting it:
Identifying systemic failure points across the supply chain before they repeat
Measuring the return on operational improvements and capital investments at a line-item level
Prioritising initiatives based on their direct impact on margin, not just their operational significance
The Documentation Problem Inside Dispute Resolution
A major barrier to successful dispute resolution is documentation availability. Evidence such as Bills of Lading, shipping confirmations, and transportation records is typically stored across siloed systems spanning AR, logistics, and warehouse teams. In many cases it exists only as PDFs or spreadsheets that are difficult to locate within the narrow window a dispute requires.
QuaerisAI’s document intelligence capabilities allow teams to locate and validate critical shipment documentation quickly, including verifying signatures and delivery confirmations. A signed Bill of Lading, for example, is often the single piece of evidence required to challenge a shipping-related deduction. When that document lives buried in a logistics system that finance cannot easily access, the dispute is lost before it begins.
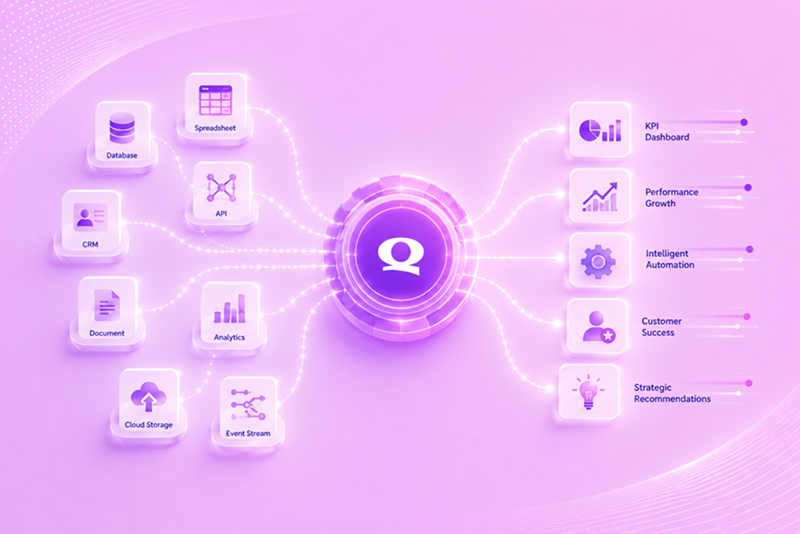
By connecting structured financial data with unstructured document repositories in a single governed query environment, QuaerisAI removes the cross-departmental coordination that currently makes dispute resolution so labour-intensive.
Understanding True SKU-Level Profitability
Deduction management has a deeper layer that most CPG organisations never reach. Most track item performance based on revenue and trade spend. Few incorporate the full impact of deductions, compliance fines, post-audit recoveries, returns, and operational penalties into a complete picture of what a product actually earns.
By unifying financial and operational data, QuaerisAI allows organisations to understand true SKU-level profitability after supply chain costs and deductions are applied. This changes the nature of the questions leadership can ask. Instead of asking which products have the highest revenue, they can ask which products have the highest margin after every downstream cost is accounted for, and which retailer relationships are eroding that margin through deduction patterns that repeat quarter after quarter.
What Changes When You Treat Deductions as an Operational Signal
Organisations that treat deductions purely as an accounting issue will always remain in a cycle of reconciliation and write-offs. The deductions keep appearing because the operational conditions that create them are never addressed.
Connecting financial outcomes to the operational events that created them changes what becomes visible. A pattern of deductions from a specific distribution centre points to a fulfilment process problem, not just a payment discrepancy. A cluster of compliance fines from a single retailer points to a labelling or scheduling gap that can be corrected at the source. The dispute is the symptom. The data is the diagnosis.
The result of this shift is improved financial visibility, stronger working capital management, and the ability to reduce profit leakage systematically rather than case by case. Deduction management stops being a reactive task and becomes a source of operational intelligence, one that informs decisions about where to invest, which retailer relationships to renegotiate, and which supply chain processes to fix before the next period’s deductions arrive.
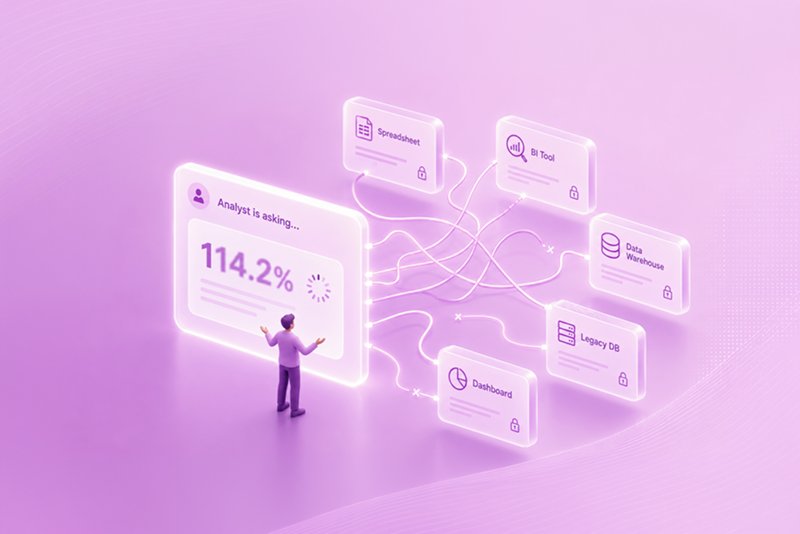
Enterprise AI projects do not fail because the models are weak. They fail because answers arrive too late. Inside modern enterprises, data already exists. Questions already exist. Yet decisions still stall. The delay lives in the space between systems, teams, and trust, and for years the default response has been to move data closer to AI. Extract it. Transform it. Copy it. Store it again.
That approach made sense at an earlier moment in the data stack’s evolution. It does not scale now, and the organisations still running it are paying a cost that rarely appears on any infrastructure budget.
Why Most AI Initiatives Slow Teams Down
On paper, the traditional model looks responsible. Data is cleaned, schemas are aligned, pipelines enforce order, and AI works on prepared datasets in controlled environments. In practice, the cost shows up somewhere else entirely.
Pipelines take months to build. Data copies multiply. Latency compounds at each handoff. Engineering becomes the gatekeeper to every new question, and business users learn to stop asking. Over time this changes behaviour in ways that are difficult to reverse. Analysts drown in repeat requests. Leaders default to instinct because the system cannot move fast enough to be useful. The problem is not intelligence. It is timing.
The Hidden Cost of Bringing Data to AI
When organisations move data to AI, they also move responsibility. Every pipeline needs maintenance. Every copy introduces risk. Every transformation creates a chance for drift. Storage costs rise quietly. Governance becomes harder because truth exists in more than one place, and proving which version is authoritative becomes its own project.
The real expense is not infrastructure. It is attention. Engineers spend their time keeping systems alive instead of improving how decisions get made. Analysts become translators instead of thinkers. Business teams wait for answers that are already stale by the time they arrive. Speed disappears without anyone noticing when it left.
What Changes When AI Goes to the Data
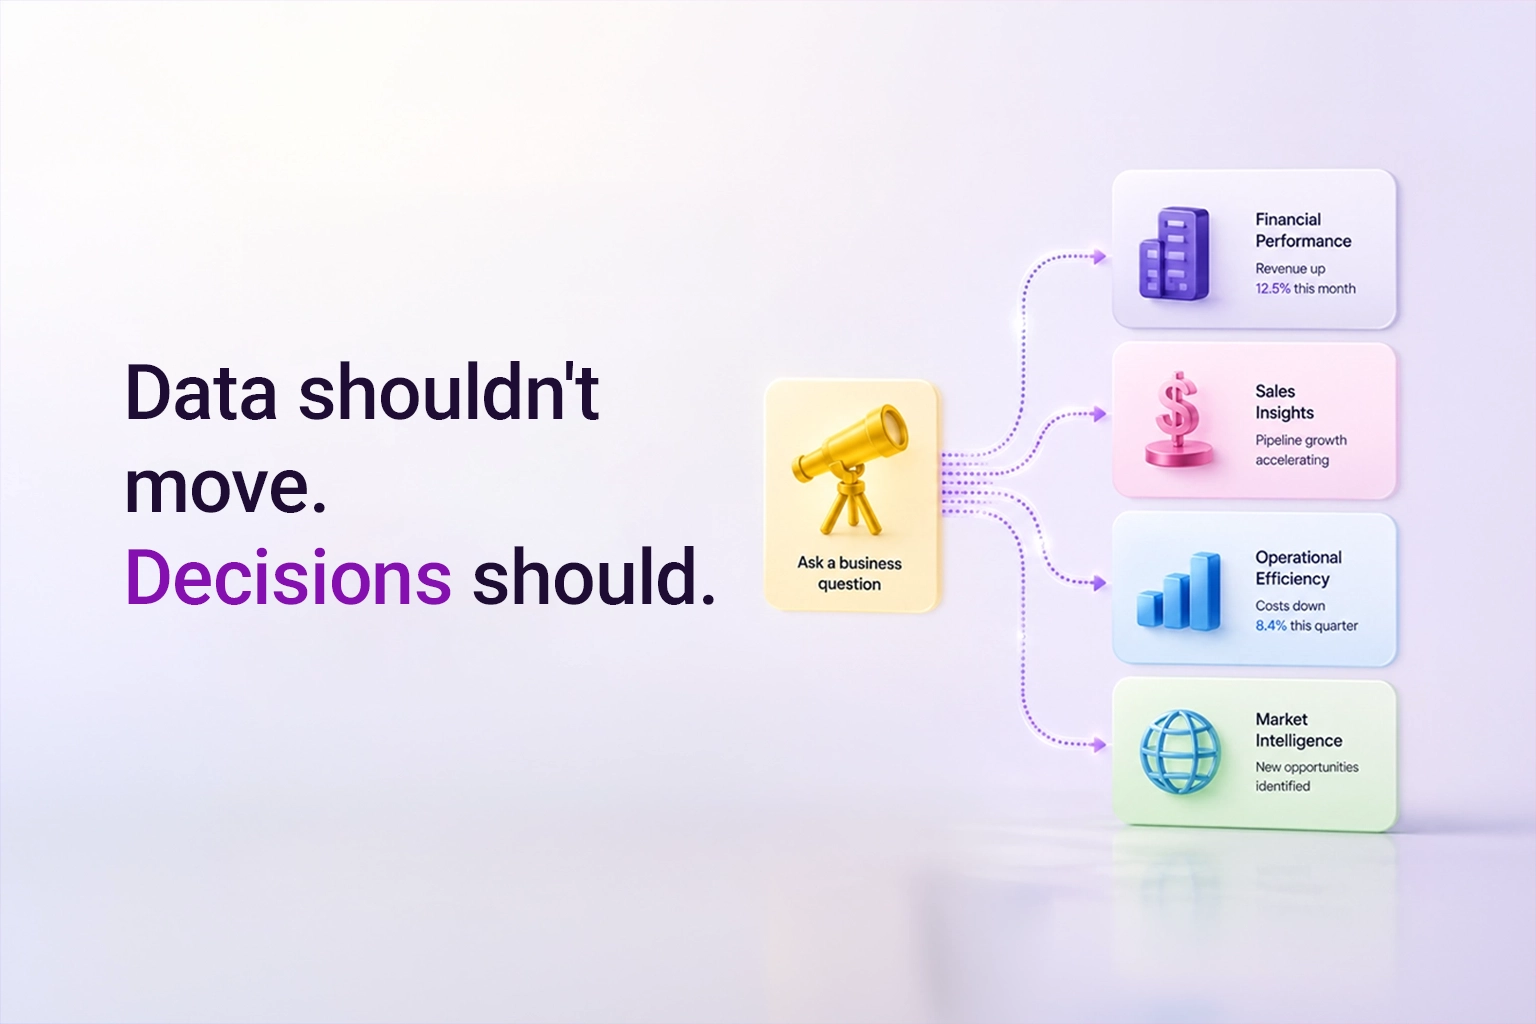
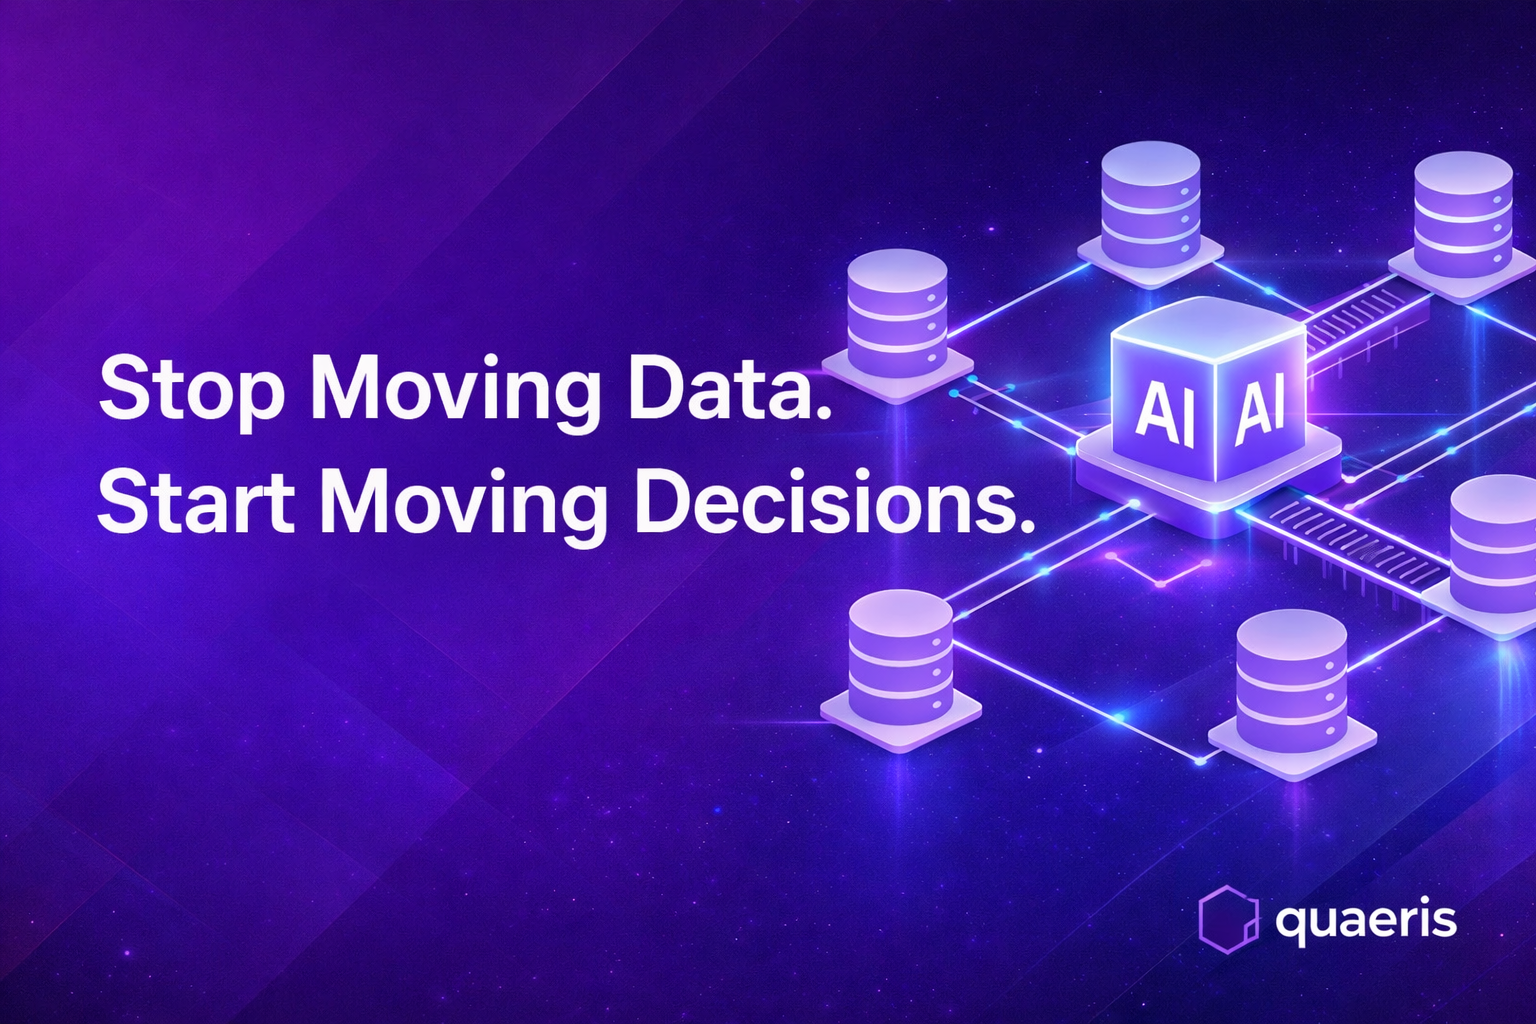
When AI connects directly to the systems where data already lives, the shape of work changes fundamentally. There is no extraction step. There is no shadow warehouse built to serve a single query surface. AI operates as a service layer that reads, reasons, and responds in place, and the effects are immediate: answers reflect current reality, storage duplication drops, latency shrinks, and the number of questions teams feel comfortable asking goes up rather than down.
Instead of preparing data for every possible question in advance, teams answer the questions that matter right now. AI becomes an access layer, not another destination. This is not about replacing the tools already in use. It is about activating them.
Governance Improves When Nothing Moves
The common concern about direct AI access is that it creates risk. In practice, copying data is what expands the risk surface. When AI queries systems in place, governance stays anchored to the source. Permissions remain intact. Audit trails are simpler. Compliance becomes clearer because there is one version of truth, and it has never moved.
This matters especially in regulated environments where explainability is not optional. Answers are not just faster. They are traceable. Trust becomes a property of the system rather than a promise made after the fact, which is the only kind of trust that holds up under scrutiny.
Decision Speed Is the Real Metric
Analytics teams have historically measured success in outputs: dashboards delivered, models trained, pipelines deployed. The business measures something different. It measures whether the decision arrived in time.
When AI meets data where it lives, speed changes behaviour across the organisation. Leaders ask follow-up questions instead of postponing meetings. Managers align teams faster because the numbers are not in dispute. Analysts spend more time on edge cases and less time rebuilding the same views for different stakeholders. Velocity returns, not because people work harder, but because the system stops getting in the way.
From Pipelines to Presence
The old model follows a familiar rhythm: build the pipeline, prepare the data, wait for results. The new model is structurally simpler: connect the systems, ask the question, act on the answer.
The shift is subtle but the compounding effect is significant. AI becomes present at the moment of need rather than bolted on afterward. It supports how decisions are actually made inside the organisation, not how architecture diagrams say they should be made. The gap between knowing and doing narrows, and that gap is where most enterprise momentum is currently being lost.
What This Means for Analytics Teams
This change is not about removing analysts. It is about restoring their leverage. When AI handles access and translation, analysts become the owners of semantic definitions and the stewards of data trust. They define what metrics mean. They guide interpretation. They protect quality without becoming a bottleneck to every downstream request.
The day-to-day work gets quieter. The strategic impact gets larger. Instead of managing a backlog, the team manages momentum, which is a fundamentally different and more valuable use of the skills that qualified analysts actually have.
What This Means for Leaders
For executives, the question is no longer which model is more capable. It is which model respects time. Every delayed answer carries a cost that compounds: missed windows, extra meetings, risk aversion, rework. Over time, hesitation becomes the organisational default, and reversing it requires more than a new tool.
Bringing AI to data shortens the distance between knowing and doing. It gives organisations the ability to move with confidence rather than caution, which is the condition required for decisions to actually land.
A Calmer Way Forward
The future of enterprise AI is not louder models or more dashboards. It is calmer systems. Systems that do not demand constant rebuilding. Systems that meet people where they already work. Systems that answer questions while there is still time to act on them.
When AI goes to the data, clarity arrives sooner. When clarity arrives sooner, decisions move. When decisions move, organisations recover the rhythm that slower systems took from them. That is the real advantage: not more intelligence, but less hesitation.
There is a step inside every enterprise data workflow that nobody budgets for, nobody measures, and almost nobody talks about. It sits between the moment a business user asks a question and the moment an answer arrives. It involves a human intermediary, a rewrite, a queue, and a delay that compounds quietly across every question the organisation ever asks. It is called translation, and it is one of the largest sources of friction in modern data operations.
The Translation Layer No One Talks About
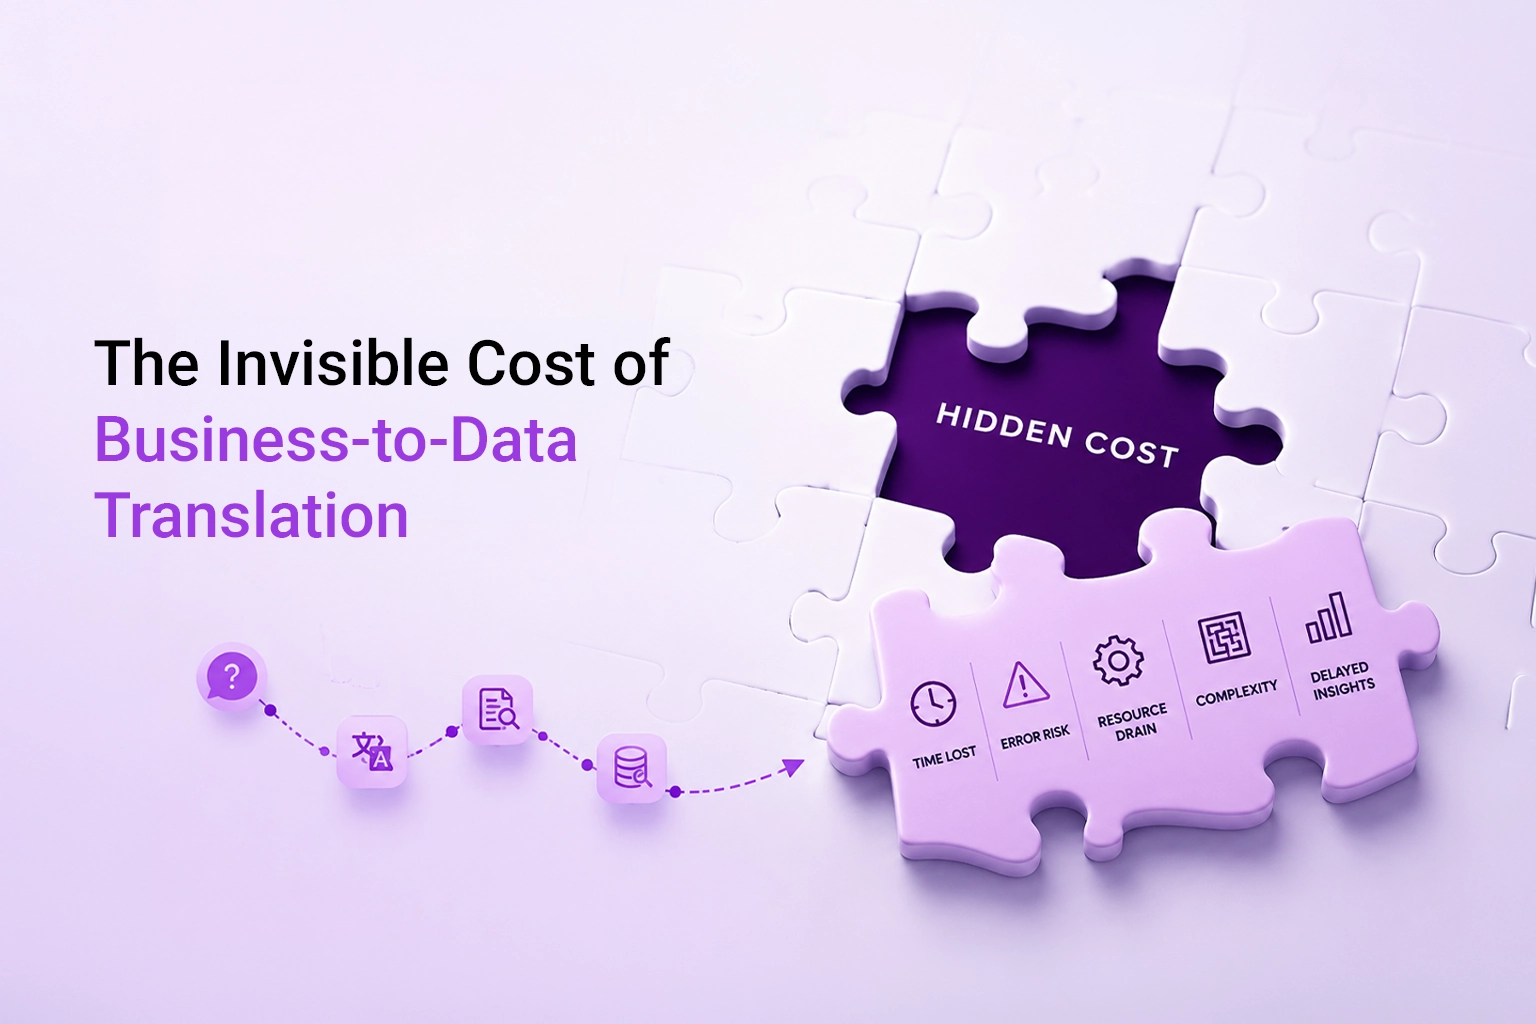
When a business user asks a question in everyday language, it does not travel directly to an answer. It enters a workflow. The question gets rewritten by someone who understands both the business intent and the data structure. An analyst interprets what was actually being asked. A query is built against the relevant dataset. Results are pulled, validated, and then returned, often days after the original question was raised.
This process has become so embedded in how enterprise data teams operate that it feels normal. It is not. It is a system built around translation rather than speed, and every translation step introduces delay that compounds across every question the organisation ever asks.
Delay Is Not Just Time. It Is Cost.
Analytics teams typically track dashboard usage, report delivery rates, and model performance. Few track the one metric that most directly connects data investment to business outcomes: time to answer. That gap matters enormously in practice.
Each translated question creates a ticket, which joins a queue, which creates a dependency on a specific analyst, which delays the decision the question was meant to inform. Individually, each instance feels manageable. Accumulated across an organisation over a quarter, it builds a decision backlog that no one has explicitly created and very few can clearly see. The organisation slows down without identifying when or why it started to.
Backlog Is the Symptom. Missed Windows Are the Outcome.
When answers take days instead of minutes, teams adapt in ways that look like efficiency but are actually risk. They stop asking questions that require a data request. They rely on instinct for decisions that should be data-informed. They reuse old reports rather than pulling current figures. They move forward without clarity because waiting for clarity costs more time than they have.
The downstream cost of this adaptation is not abstract. Pricing windows close before the margin analysis arrives. Market shifts go undetected until they appear in end-of-quarter results. Operational issues surface late because no one had asked the question that would have caught them early. By the time the answer arrives, the moment it was meant to serve has passed.
The Analyst Bottleneck Was Never the Goal
Analysts are not the problem here. They are doing exactly what the system requires of them. The system is the problem. It routes every business question through a translation step that requires a human intermediary, forcing analysts into a loop of interpreting business language, converting it into queries, and delivering the same categories of answer repeatedly to different stakeholders.
This is low-leverage work for people hired to do high-leverage thinking. It creates dependency rather than capability. It limits the scale of what a data team can support. And it buries expertise under volume, so the most capable analysts spend the most time on the most routine requests because those requests never stop arriving.
Translation Breaks Trust as Well as Speed
Speed is one dimension of the problem. Trust is another, and in regulated or high-stakes environments it is often the more damaging one. Every time a question is translated, there is a risk that what the business meant is not precisely what the query captures. The business user receives an answer and is not entirely certain it reflects what they asked. They request a follow-up. They validate the output manually. They ask for a revised version.
Each of these steps extends the cycle further. Speed drops. Confidence drops alongside it. And when confidence in the answer drops, the decision it was supposed to support stalls. Speed without trust creates risk rather than removing it. The compounding cost of repeated translation is not just slower decisions. It is decisions made with less confidence, which is a different and more persistent problem.
The Workflow Becomes the Problem
At scale, the pattern is consistent across organisations. Questions require tickets. Tickets require translation. Translation creates delay. Delay creates hesitation. Hesitation creates risk. This is not a data problem and it is not an analyst capacity problem. It is a workflow problem, and it cannot be fixed by adding more dashboards or more headcount, because neither of those changes removes the translation step that sits between question and answer.
What Removing Translation Actually Changes
When business users can ask questions in their own words and receive governed, explainable answers directly, the workflow resets at every level of the organisation. For business leaders, questions get answered inside the window when action is still possible, and decisions that previously required a data request become immediate. For analysts, the volume of repeat requests drops, and the time recovered goes toward the complex, judgment-intensive work that actually requires their expertise. For the organisation overall, decision backlog shrinks, workflow simplifies, and the time between question and action compresses to a degree that changes how teams behave rather than just how fast a single query runs.
Where Quaeris Fits
Quaeris removes the need to translate business questions into queries. Teams ask questions in their own words and receive trusted, explainable answers grounded in governed data, without a ticket, without a rewrite, and without a queue. Every answer carries its source and lineage so the business user can see exactly where the number came from and why the system produced that specific result.
This is not a faster dashboard. It is a different point of intervention: a decision acceleration layer that connects data, documents, and context and closes the gap between question and action at the moment the question is asked, not days afterward.
The Real Metric
The hidden cost of translating business questions is not technical debt. It is temporal debt. Every translated question adds time. Every added hour increases the risk that the decision it was meant to inform arrives too late to matter. Every delay reduces the window in which action is still possible.
Organisations that remove translation do not just move faster. They ask more questions, trust more answers, and act before the moment passes. That is the compounding advantage that closing the gap between question and action actually produces.
Every organisation collecting data is making an implicit bet: that the data will eventually influence a decision. The size of the data warehouse, the sophistication of the pipeline, the number of dashboards maintained, none of it has inherent value. The value only materialises at the moment a decision is made better because of it. Everything before that moment is cost. The decision is the return.
This framing matters because most organisations measure the wrong things. They track data volume, dashboard usage, and query counts. They rarely track how often a business decision was made faster, or more accurately, because of the data available to the person making it. The gap between those two measurement approaches explains why organisations can have world-class data infrastructure and still feel like they are flying blind.
The Distance Between Data and Decision
In most enterprises, data and decisions do not live in the same place. Data lives in warehouses, pipelines, and dashboards maintained by a technical team. Decisions live in meetings, calls, and planning cycles run by business leaders. The distance between the two is bridged by a process: someone with a question requests an answer from someone with data access, waits for it, receives it, and then decides whether to trust it enough to act on it.
Every step in that process introduces delay. And delay has a specific cost in decision-making contexts: the window to act narrows, the situation changes, and the answer that arrives is answering a slightly different question than the one that was asked. By the time a finance leader has a verified variance analysis, the budget cycle that needed it may have already closed. By the time a sales director has pipeline coverage data, the quarter it was meant to inform is already in its final week.
The data existed. The decision was still made without it, or made on older data that was less accurate. The value that could have been realised was not, because the timing was wrong.
Why Timing Is the Underrated Variable
Most conversations about data quality focus on accuracy. Most conversations about data access focus on permissions and tooling. Relatively few focus on timing, even though timing is frequently the variable that determines whether data influences a decision at all.
A perfectly accurate answer that arrives two days after the decision was made has a value of zero to that decision. An answer that is 95% accurate and arrives before the meeting starts has real value. This is not an argument for trading accuracy for speed. It is an argument that the delivery architecture matters as much as the data itself, and that most organisations have invested heavily in the former without solving the latter.
The organisations where data consistently influences decisions are not necessarily the ones with the most data or the most sophisticated models. They are the ones where the person making the decision can get a trustworthy answer before the decision point, not after it.
What Breaks the Connection Between Data and Decision
Three structural problems account for most of the gap between data availability and decision quality in large organisations.
The first is access friction. Getting an answer requires knowing which dashboard contains the relevant metric, understanding how to interpret it, and trusting that the definition it uses matches what the business actually means by that term. For non-technical decision makers, these requirements are often too high. They either rely on an analyst intermediary, which introduces delay, or they make the decision without the data, which introduces risk.
The second is definition inconsistency. When the same question asked by two different teams returns two different numbers, the result is not just confusion. It is a systematic erosion of trust in data as a decision-making input. Once a finance director has been burned by a discrepancy between what the CRM reports and what the ERP reports, they begin treating data as a starting point for a debate rather than a basis for a decision.
The third is reactive intelligence. Most analytics infrastructure is built to answer questions after they are asked. It is not built to surface the information a decision maker needs before they know they need it. A sales leader should not have to remember to check pipeline coverage every Friday morning. The system should alert them when coverage drops below the threshold that matters, at the moment it happens.
What Changes When Data Reaches the Decision
When these structural problems are addressed, the nature of the relationship between data and decisions changes in a concrete way. Decision makers stop treating data as something that requires effort to reach and start treating it as something that is already present when they need it. The question “do we have data on this?” is replaced by “what does the data say?” That shift, while it sounds simple, represents a fundamentally different operating model.
The decisions that benefit most from this shift are not the large strategic ones that get weeks of analysis time. Those decisions already get the data they need. The decisions that change are the daily and weekly ones: which accounts to prioritise, whether a budget variance warrants immediate action, which operational metrics are drifting outside acceptable ranges. These decisions are made constantly, they are made quickly, and they are made with whatever information is immediately to hand. When that information is accurate and governed, the cumulative effect on business outcomes is significant.
The Governance Requirement
Speed without trust does not solve the problem. If a business leader receives a fast answer but cannot verify where it came from, whether the metric definition matches the one used in last quarter’s board presentation, or whether they were supposed to have access to that data at all, the answer will not influence the decision. It will trigger a verification process that reintroduces the same delay the speed was meant to eliminate.
This is the fundamental weakness of general-purpose AI tools applied to business data questions. They can generate answers quickly. They cannot guarantee that those answers are grounded in the organisation’s actual definitions, drawn from authorised data sources, and scoped to the querying user’s role. For a finance leader making a budget decision, or a compliance officer reviewing a control exception, that guarantee is not optional. It is the difference between an answer they can act on and an answer they have to verify before they can act on it.
Governed analytics addresses this by ensuring every answer carries its source, its metric version, and its access record. The decision maker does not need to trust the system blindly. They can verify the answer the same way they would verify any other business number, which means they actually use it.
The Measure That Actually Matters
If an organisation wants to understand whether its data investment is delivering returns, the most useful question is not how much data it has, how many dashboards it maintains, or how many queries it processes per month. The most useful question is: how often does a decision maker have the information they need, at the moment they need it, in a form they trust enough to act on?
Every other metric is a proxy for that one. And every investment in data infrastructure that does not ultimately improve that number is investment that has not yet reached the point where value is created.
Data value is not realised when data is collected. It is not realised when data is stored, processed, or visualised. It is realised at the moment a decision becomes better because of it. Building the infrastructure that connects those two things is the actual problem worth solving.
A majority of analytics teams are not underperforming. They are working at full capacity inside a system that was never designed to scale with the volume of questions a modern business generates. The problem is not the people. It is the architecture built around them, and understanding that distinction is the first step to fixing it.
The Repeatable Pattern
When analytics teams fall behind, the instinctive responses tend to follow a familiar sequence. Leaders call for more dashboards. Procurement teams evaluate new tools. Hiring managers post for more analysts. None of these address the actual problem.
Most organisations already have more data than they can use, more dashboards than any team trusts, and more incoming requests than a reasonably sized analytics function can clear. And yet, despite all of that investment, the same failure mode keeps appearing: a question gets asked, and the answer does not arrive fast enough for the decision it was meant to inform. That lag, multiplied across every team and every decision cycle, is where the real cost lives.
What Analysts Actually Do All Day
There is a large gap between what analytics teams are hired to do and what they actually spend their time on. The honest version of the job description at most organisations looks something like this: answering the same question from a different stakeholder for the twelfth time, rebuilding the same business logic in a slightly different format, chasing down metric definitions that should have been standardised long ago, sitting in meetings explaining numbers that the audience does not fully trust, and working through a request backlog that adds items faster than it clears them.
This is not insight generation. It is ticket management with a SQL layer on top. The analysts doing this work are not slow or untalented. They are allocated to work that should not exist in the form it currently does, and the best ones feel it most acutely because they can see clearly what they would rather be doing.
Where the Bottleneck Actually Is
When decisions take too long, the analytics team is usually the first place leadership looks. This is the wrong diagnosis. The bottleneck is not the analyst. It is the system that requires every business question to travel through a human intermediary before it can be answered.
The standard path is predictable: a business user has a question, they submit a request, it joins a queue, it eventually gets prioritised, an analyst works on it, and the answer arrives days later, sometimes after the window to act on it has already closed. The system routes every question through a person regardless of whether that question actually requires one. When you build a structure where thinking does not scale, the problem is not the thinkers.
Why AI Creates Anxiety on Analytics Teams
When AI tools arrive with the promise of instant answers, the reaction from analytics professionals is often scepticism or outright resistance. This is a rational response. The framing of AI as something that can answer questions automatically sounds, from the analyst’s perspective, like a straightforward argument that the analyst’s role is redundant.
The more accurate framing is different. If AI takes over any portion of the analytics function, the work it displaces is the work that analytics teams find least valuable and most draining: the repeat questions, the low-complexity extractions, the formatting requests, the work that should never have required a credentialled analyst in the first place. The genuine risk for analytics professionals is not AI replacing them. It is staying inside a system that continues to allocate their time to work that a machine could handle, while the higher-value work they are capable of never gets done.
The Shift Most Organisations Have Not Made
The more useful frame for AI in analytics is this: it does not replace analysts, but it does expose how much of what currently occupies an analyst’s day should never have been their job. When the repeat questions are handled automatically, when definitions are standardised and no longer require manual interpretation, when routine extractions no longer require a ticket, what is left is the work that actually requires human judgment, contextual knowledge, and strategic thinking.
The practical outcomes of this shift are measurable. Request backlogs shrink. Metric definitions stabilise because they are enforced consistently rather than reinterpreted per request. Business users get faster access to answers they can trust. And analysts, freed from the low-value queue, can focus on the analysis that actually influences decisions rather than reporting on decisions that have already been made.
The Two Options Available
When an analytics team is consistently overwhelmed, there are two available responses. The first is to add headcount and continue operating the same system, which distributes the load without addressing the structural cause. The second is to fix the system so that the team’s capacity is allocated to work that requires their expertise.
Most organisations choose the first option because it feels more immediate and more controllable. It also explains why the problem tends to persist regardless of how many analysts are added. The queue expands to meet the available capacity, and the cycle continues.
What Actually Changes
When the structural problem is addressed and analysts are no longer the required intermediary for every data question, the nature of their contribution shifts in a meaningful way. They become the owners of data definitions and business context rather than the executors of routine requests. They move from explaining last quarter’s numbers in meetings to helping shape how next quarter’s decisions get made. Their value does not decrease. It becomes more visible because it is being applied to work where it is genuinely differentiated.
This is also why most AI implementations in analytics fail to deliver on their stated promise. They focus on replacing outputs, generating automated reports and pre-built dashboards, without addressing the underlying system that created the bottleneck. Automating the wrong workflow at higher speed does not fix the problem. It accelerates it.
What the Goal Actually Was
The dashboards were never the goal. The analysts were never the goal. The goal was always faster, more reliable decisions made by the people responsible for them. If the current system cannot consistently deliver that, the answer is not to add more of the same components. It is to change what the system asks of the people inside it.
Fixing the structure around an analytics team is harder and slower than adding headcount. It is also the only approach that actually resolves the problem rather than deferring it.
Speed is a priority for almost every modern organization.
Leaders want faster decisions, faster execution, and faster response to market changes. The instinct is often to add more control: more approvals, more escalation, more direction from the top.
That can create movement for a short period. It rarely creates durable speed.
Organizations move faster when teams understand the reasoning behind decisions, trust the information they are using, and know where they have room to act. Authority can assign work. Alignment helps people carry it forward without waiting for repeated direction.
The hidden cost of hierarchy
Hierarchy has a clear role in any organization. It defines ownership, creates accountability, and gives teams a path for escalation.
The problem begins when hierarchy becomes the main engine of decision-making.
In many organizations, decisions are made by a small group of leaders while execution sits with the broader team. Context stays near the top. Instructions move downward.
That gap creates friction.
People may follow the decision, but they may not understand the tradeoffs behind it. When conditions change, they hesitate. When new data appears, they escalate. When the original plan no longer fits the situation, they wait for permission.
This is where speed starts to break down. The organization appears active, but the work slows under the surface.
Control creates compliance. Alignment creates ownership.
Control can make a team move. Alignment helps a team make better decisions while moving.
A control-led operating model depends on instruction, enforcement, and review. It can work when the problem is simple and the environment is stable. It becomes weaker when teams need to respond to changing information.
An alignment-led operating model gives people the context they need to act with judgment. Teams understand the goal, the data behind the decision, the risks involved, and the constraints they must respect.
That difference changes behavior.
People with context can adapt. People with only instructions tend to wait.
For organizations that need speed at scale, this distinction matters. The goal is not to remove leadership authority. The goal is to reduce unnecessary dependence on authority for every small adjustment.
Why understanding improves decision velocity
Decisions become easier to execute when people understand why they were made.
Understanding gives teams three things that instruction alone cannot provide:
• Judgment in local situations • Confidence when conditions change • Ownership of the outcome
A team that understands the reasoning behind a decision can respond without reopening the entire discussion. They can identify when an exception matters. They can decide when to proceed, when to escalate, and when to adjust.
This is how execution becomes faster without becoming careless.
When people lack context, they protect themselves by slowing down. They ask for more confirmation. They check the same answer again. They wait for someone senior to approve the next step.
The delay is rational. It is also costly.
Trust is a system property
Trust is often treated as a cultural value. In decision-making, it is also an operating condition.
When trust is low, every decision requires more review. Every answer is questioned. Every number is checked again. Every action carries more perceived risk.
When trust is high, decisions move with less friction.
Trust forms when answers are clear, explainable, shared, and consistent. This applies to leadership decisions, operational decisions, and data-driven decisions.
If different teams see different answers to the same question, speed drops. If a number cannot be traced back to its source, confidence drops. If teams do not know which metric is approved, they spend time debating the basis for action instead of acting.
This is one of the reasons decision velocity is often a data alignment problem.
The data problem behind slow execution
Many organizations assume slow decisions come from limited data access. The response is to add more dashboards, reports, and tools.
Access matters, but access alone does not create alignment.
Teams can have more data than ever and still move slowly if they do not trust the answer, understand the context, or agree on the source of truth.
The common pattern looks familiar:
• Finance has one number • Operations has another number • The dashboard shows a third number • A spreadsheet from last week tells a different story
At that point, the decision slows. Teams recheck the data. Reports are rebuilt. Meetings become reconciliation sessions. Leaders step in to force a call.
The underlying issue is not the absence of information. It is the absence of shared confidence.
Alignment requires shared context
Alignment does not require agreement on every detail. It requires a shared understanding of the decision environment.
That means teams can answer basic questions before execution begins:
• What decision are we trying to make? • What information supports it? • Which source is trusted? • What assumptions are being used? • What tradeoffs were considered? • Where does the team have room to act?
When this context is visible, people stop reopening settled questions. They spend less time translating decisions across teams. They understand the boundaries of their own judgment.
The failure mode of top-down speed
That is how organizations create speed without adding pressure.
Leaders often try to increase speed by tightening the system.
They shorten deadlines. They reduce discussion. They centralize approvals. They push teams to move faster.
These moves can create urgency. They do not always create clarity.
Without alignment, urgency often turns into rework. Teams rush into execution, then return to the same questions later. The decision gets revisited. The data gets challenged. The work drifts.
This is not always a leadership failure. Often, it is a systems failure.
The organization has not created enough shared context for people to act with confidence.
What alignment looks like in practice
Aligned organizations behave differently.
They make decisions visible. They share the reasoning behind those decisions. They give teams access to trusted answers. They make it clear which data, assumptions, and constraints matter.
As a result, teams need fewer escalations. They can respond to change with more confidence. They understand when to act and when to ask for help.
This creates a steadier operating rhythm.
Speed becomes less dependent on individual heroics and more dependent on the quality of the decision system.
Where QuaerisAI fits
Human alignment depends on information alignment.
When data systems produce conflicting answers, trust erodes. When answers cannot be explained, hesitation grows. When teams do not know where a number came from, decisions slow down.
QuaerisAI is built around a simple operating principle: teams move faster when they can ask questions in their own words, receive governed answers, and understand how those answers were formed.
The role of the system is not to replace judgment. It is to reduce friction between question, answer, and action.
That means helping teams work from shared context, trusted sources, and explainable outputs. In regulated industries, this matters even more because speed without control can create risk.
Better decision systems do not only return answers. They help organizations understand, trust, and act on those answers.
Alignment is the real lever
Authority can start action. Alignment sustains execution.
When teams understand the reasoning behind decisions, trust the answers they see, and know where they can act, speed becomes easier to scale.
For leaders, the practical questions are straightforward:
• Do teams understand why decisions are made? • Do they trust the information behind those decisions? • Can they see the context and assumptions clearly? • Do they know when they can act without escalation?
If the answer is no, more pressure will only create temporary movement.
Teams inside enterprise organisations are not short on data. They have data warehouses, BI dashboards, weekly reporting decks, and analytics teams paid specifically to surface findings. What they are short on is the ability to act on that data before the moment to act has passed. This is not a data volume problem or a tooling problem. It is a structural problem in how decisions get made, and why the gap between a question and a governed answer still costs organisations weeks of compounded delay every quarter.
The Actual Problem Managers Face
A finance manager, a regional sales director, or a risk officer does not lack access to dashboards. What they lack is the ability to get a direct, trustworthy answer to the specific question in front of them right now. Questions like “which accounts shifted from green to amber this week,” “where is the margin variance coming from in APAC,” and “which portfolio exposures are approaching threshold” are not questions that fit neatly inside a pre-built report. When they arise, the standard path is to raise a ticket with a data analyst, wait two to four days for a response, and then spend the next meeting deciding whether the number is even correct.
By the time the answer arrives, the window to act on it has frequently closed. A deal has moved to a competitor. A claims reserve has gone unreviewed for another cycle. A budget decision has been made on last month’s assumptions because this month’s were not ready in time. This is what decision drag actually costs, and it compounds silently across every team that runs this way.
Why Traditional Analytics Did Not Solve This
Business intelligence platforms were built to answer known questions at scale. They work well when the question is stable, the audience is technical, and the answer can wait. For the operating manager who needs an answer in the next thirty minutes before a leadership call, they are the wrong tool. Dashboards require navigation. Pre-built reports require knowing the right report exists. Ad-hoc queries require SQL or an analyst who writes it.
The result is a paradox common to almost every data-mature enterprise: more investment in analytics infrastructure, and no reduction in the time it takes a non-technical manager to get a confident answer to a business question. The infrastructure serves the data team. It rarely serves the person making the decision.
The Hidden Cost of Repeated Delay
When teams learn through experience that getting a data-backed answer takes days, they adapt. They stop asking. They rely on prior-period assumptions, gut instinct, or whatever number they can pull from a spreadsheet they already have. Over time, this produces a kind of institutional learned helplessness around data: teams that nominally have access to rich analytics but functionally operate without it because the friction of access outweighs the perceived value.
The more damaging outcome is that this pattern becomes invisible. Leaders see the dashboards in use and assume decisions are being made from data. The dashboards are being opened. The decisions are not being made from them.
What the Shift to Governed Agentic Analytics Actually Changes
A governed agentic analytics platform changes the economics of the question-to-answer path. Instead of a manager raising a request and waiting, any authorised team member asks a question in their own words and receives a sourced, governed answer drawn directly from the connected data warehouse. The answer includes its source, the metric definition it used, and the data lineage behind it, so the manager can stand behind it in a leadership meeting without needing to verify it separately.
For a finance leader reviewing variance against plan, this means asking “why did operating costs spike in Q3” and receiving a breakdown by cost centre, sourced to the relevant general ledger entries, in under a minute. For an insurance underwriting manager, it means asking “which policies in the APAC book are approaching loss ratio threshold” and getting a role-scoped answer that reflects only the data they are authorised to see, with a full audit trail attached. The answer is not generated from inference. It is drawn from certified metrics in the semantic layer, the same definitions the data team has validated and the same source rows that would appear in a regulatory filing.
Why Trust Is the Prerequisite, Not Speed
Speed without trust does not change behaviour. If the manager receiving a fast answer has any reason to doubt it, the workflow immediately reverts to the old pattern: double-check with the analyst, cross-reference the dashboard, raise it in the meeting as a question rather than a decision. Most AI tools deployed at the enterprise level have failed at exactly this point. They generate answers quickly. They cannot tell the user where the answer came from, whether the metric definition matches the one the CFO used last quarter, or whether the data has been role-filtered correctly.
Governed agentic analytics is differentiated specifically at this point. Every answer carries its source citation, its metric version, and its access control record. The manager does not need to trust the AI. They can verify the answer in the same way they would verify any other business number, which means they actually use it.
What Changes
The practical outcome is not that the manager is replaced or that their judgment becomes less important. It is that they spend substantially less time in the data retrieval loop and substantially more time on the decisions that require their experience. The weekly pipeline review stops being a data reconciliation exercise and starts being a conversation about what to do. The monthly close stops being a chase for the right numbers and starts being a review of decisions already made from good ones.
Teams that operate this way move faster not because they have more data but because the time between a question and a confident, governed answer has been reduced from days to minutes. That compression, applied consistently across every team and every decision cycle, is where the measurable performance difference appears.
Something has to change. Not incrementally. Structurally.
Here is the uncomfortable reality facing accounting firms in 2026: the accounting workforce has shrunk by over 17% since 2020, regulatory scrutiny is intensifying, and clients expect more, faster, for the same fee. The traditional audit model, built on sampling, manual document matching, and hours of workpaper writing, was never designed to absorb this pressure.
QuaerisAI is built for exactly this shift. Not as another analytics dashboard that auditors need to learn. Not as a generic AI assistant that guesses at financial figures. But as a purpose-built Agentic Audit Intelligence platform that fundamentally changes the economics, quality, and scalability of the modern audit engagement.
Here is what that change looks like, phase by phase, number by number.
The Architecture Behind the Advantage
Before diving into specific use cases, it is worth understanding what makes QuaerisAI different from the standard AI tools being applied to audit workflows. Three components work together.
The Agentic Layer. Instead of waiting for an auditor to ask a question, QuaerisAI’s agents act autonomously. They go find data, flag anomalies, test populations, and draft documentation without a human having to trigger each step.
The Semantic and Context Layer. A single, vetted source of truth for all audit logic and business definitions. When QuaerisAI says “Gross Contribution Margin,” it is using the exact calculation the firm has defined, not an LLM approximation. This eliminates the hallucination risk that makes generic AI tools unusable in a regulatory context. The Semantic Layer captures your business definitions and those of your clients, standardised across the organisation.
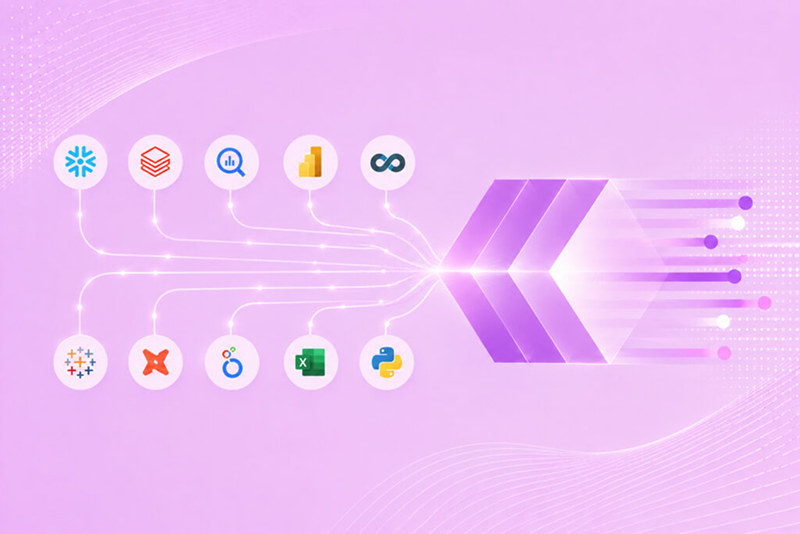
Converged Search. A unified interface that links structured data (ERP systems, ledger entries, databases) with unstructured evidence (PDF contracts, invoices, bank statements). Auditors can query both simultaneously, in their own words.
Together, these three capabilities change each phase of an audit engagement.
Phase 1: Data Intake and PBC Collection – Stop Chasing, Start Reviewing
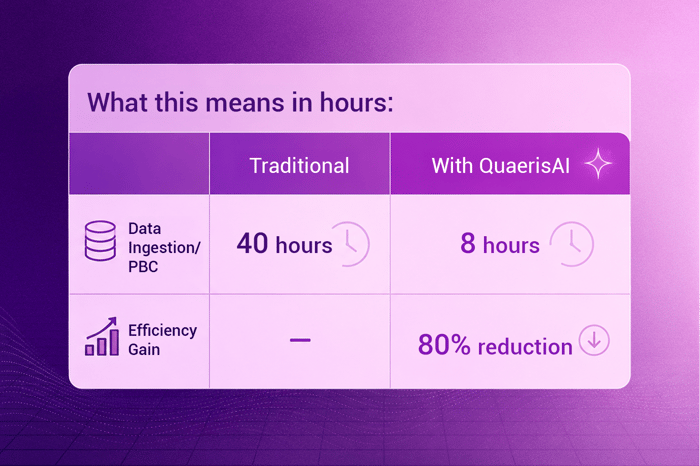
The traditional pain: Every audit begins with a Prepared By Client (PBC) list, a manual request for documents that kicks off weeks of follow-up emails, missing files, version conflicts, and administrative back and forth. For most firms, this phase alone consumes 20% of total engagement hours.
The QuaerisAI approach: Automated PBC Agents connect directly to the client’s data lakes and systems, retrieving and verifying evidence autonomously, without waiting for the client to send it.
The auditor stops being a document chaser. They become a document reviewer.
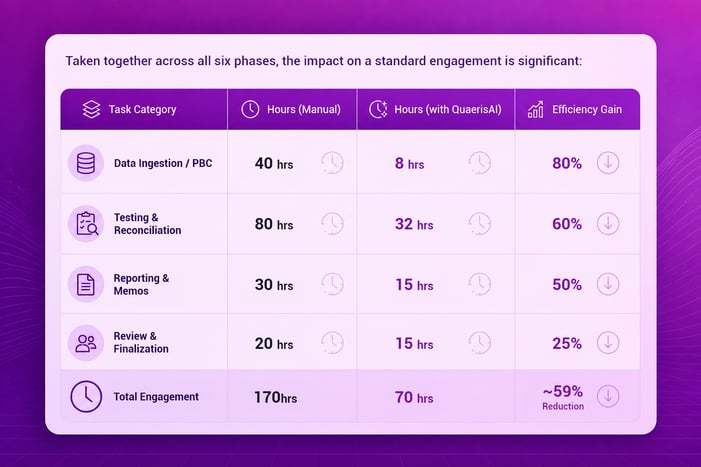
An 80% reduction in administrative follow-up time, on a phase that typically consumes 40 hours per engagement, frees senior staff for the judgment-intensive work that actually requires their expertise.
Phase 2: Transaction Testing – From Sampling to 100% Population Coverage
The traditional pain: The cornerstone of traditional audit testing is statistical sampling. Test 50 to 100 transactions. Assume the rest are fine. Hope nothing significant hides outside the sample. This approach was a practical necessity, not a methodology preference. It was the only option when testing every transaction required human eyes on every document.
The QuaerisAI approach: Autonomous agents scan every single transaction in the population for anomalies. Not a sample. Every transaction. Agents use Self-Generating SQL to accelerate the investigation of outliers, without requiring an IT expert or SQL-fluent auditor to write a single query.
This is not just a speed improvement. It is a coverage transformation. Audit risk does not hide in the sample. It hides in what the sample misses.
Phase 3: Evidence Vouching — Linking the Ledger to the Document
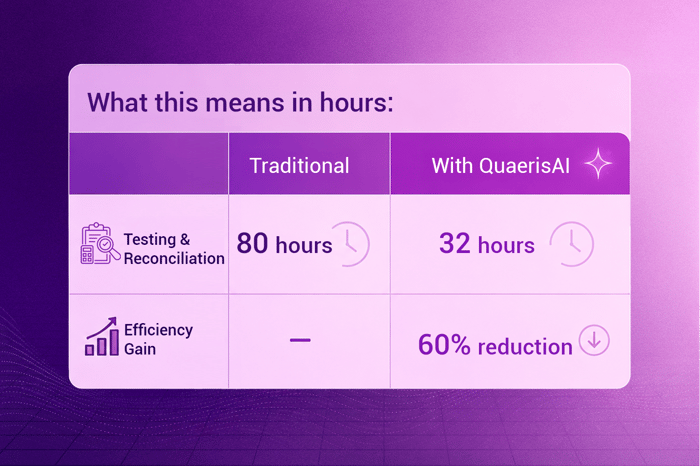
The traditional pain: One of the most labour-intensive tasks in any audit is vouching, manually matching ledger entries to their underlying evidence: PDF invoices, contracts, purchase orders, bank statements. A senior associate sitting at a desk, cross-referencing document against document, for hours.
Humans get fatigued at hour 10 of vouching. Agents do not.
The QuaerisAI approach: Converged Search agents automatically link structured ERP data to unstructured document evidence. Using NLP and OCR integration, QuaerisAI can read contracts to confirm whether revenue recognition matches the terms actually written in the fine print. The system flags the 5% that do not reconcile. The auditor reviews those, not the 95% that are correct.
“Show me all intercompany transfers that lack a signed agreement.”
That question, asked directly to QuaerisAI, replaces hours of manual cross-referencing. No SQL. No dashboard navigation. No training required.
Phase 4: Control Monitoring — From Annual Checks to Continuous Assurance
The traditional pain: Internal controls are typically assessed at a point in time, once a year, or once a quarter. In a business environment that changes weekly, this creates a structural blind spot. Policy drift, new transaction patterns, emerging anomalies; these can live undiscovered for months between assessments.
The QuaerisAI approach: Real-time Continuous Assurance monitoring flags policy drift the moment it happens. Rather than discovering a control failure during the annual assessment, firms and their clients know about it in real time.
The Semantic Layer is the key enabler here. Because all audit logic is defined in one vetted source of truth, monitoring rules are applied with 100% consistency, not interpreted differently by different staff members across different engagements.
This capability moves audit from a retrospective compliance exercise to a forward-looking risk management function, a shift that many audit firm clients are actively seeking.
Phase 5: Workpaper Documentation – From Writing to Reviewing
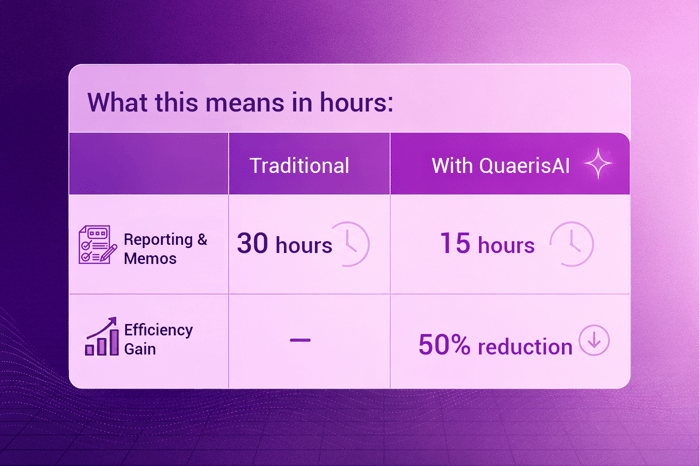
The traditional pain: Auditors spend approximately 40% of their time on documentation, drafting workpapers, writing memos to explain testing methodology, citing evidence, summarising conclusions. This is not trivial work, but it is also not the work that requires a credentialled auditor’s highest-order judgment.
The QuaerisAI approach: Narrative Agents automatically draft the Memo to File, explaining testing logic, documenting the reasoning path, and citing the evidence used. The auditor’s role shifts from writing the first draft from scratch to reviewing and signing off on a draft that has already been generated.
Auditors ask for the summary in conversational language and receive a professional first draft.
Phase 6: Risk Assessment – From Gut Feel to Predictive Intelligence
The traditional pain: Audit risk assessment has historically been driven by two things: the prior year’s workpapers and the senior partner’s intuition. Both are useful. Neither is sufficient in a business environment defined by rapid change, new transaction structures, and sophisticated financial engineering.
The QuaerisAI approach: Predictive Risk Mapping analyses current-year trends to suggest high-risk focal points before the audit begins. The Agentic Reasoning capability connects disparate data points to surface non-obvious fraud patterns, the kind that do not appear in a single anomalous transaction but emerge only when multiple signals are correlated across systems.
This is where AI delivers differentiated value beyond efficiency. Not just doing the existing workflow faster, but identifying risks that the existing workflow would never have caught.
For a typical mid-sized engagement that runs 200 hours, QuaerisAI realistically reclaims 80 to 100 hours. That is not an incremental efficiency improvement. That is a fundamentally different engagement economics model.
Why This Is Different From Standard AI Tools
The accounting profession has seen a wave of AI tools marketed at audit teams. Most of them share the same fundamental weakness: they are general-purpose language models applied to a specialised domain without the guardrails that domain requires.
QuaerisAI addresses this directly in three ways.
Trust via the Semantic Layer. Unlike standard LLMs that can generate a plausible-sounding answer that is factually wrong, QuaerisAI’s Semantic Knowledge Graph ensures the system only uses vetted, audited business logic. Every metric, every calculation, every definition has been defined and approved by the firm. The system cannot improvise.
Zero-Dashboard Efficiency. Adopting a new analytics platform in an audit environment typically requires weeks of staff training and change management. QuaerisAI eliminates this friction entirely. Auditors do not learn new software. They ask questions and receive answers. Training time approaches zero.
Solves the Talent Crisis Directly. With the accounting workforce down over 17% since 2020, firms are being asked to do more with fewer people. QuaerisAI acts as a Digital Associate, handling the grunt work of vouching, reconciliation, and documentation so that senior auditors can focus on the high-level judgment that actually requires their expertise and credential.
The ROI for Audit Partners: Four Numbers That Matter
For firm partners evaluating this investment, the financial case comes down to four dynamics.
1. Increased Capacity. A single Senior Associate, supported by QuaerisAI Agents, can now effectively oversee 3 to 4 engagements simultaneously rather than 1 to 2. This multiplies revenue capacity without proportionally increasing headcount costs.
2. Margin Protection. In a fixed-fee audit environment, which is the dominant pricing model for most mid-market engagements, every hour saved drops directly to the firm’s bottom line. A 59% reduction in engagement hours on a fixed fee is not an efficiency metric. It is a margin metric.
3. Burnout and Retention. Junior staff attrition is one of the most expensive operational problems accounting firms face today. The leading driver is well-documented: the disproportionate burden of low-value work, data entry, manual vouching, document chasing, in the early years of a career. By removing this work from the workflow, firms can meaningfully improve the experience for junior staff and reduce the attrition that is driving the talent shortage.
4. Error Reduction and PCAOB Risk. Manual vouching at scale is vulnerable to human fatigue. Auditors get tired at hour 10 of matching invoices to ledger entries. Agents do not. This reduces both the risk of audit failure and the risk of a PCAOB deficiency finding, reputational and regulatory risks that no firm can afford.
The Shift That Is Already Happening
The audit profession is not waiting for AI to mature. The firms pulling ahead are deploying it now, using the talent shortage and regulatory pressure not as reasons to delay, but as the business case to accelerate.
The transition from “Manual and Sample-Based” to “Agentic and Continuous” auditing is not a five-year horizon. It is happening in 2026. The question is whether your firm is building the capability advantage now, or watching competitors do it first.
See QuaerisAI in Action on Your Audit Workflows
QuaerisAI integrates with the data systems your clients already use, connecting to ERP platforms, data lakes, document repositories, and financial systems without moving or duplicating source data. Deployment is measured in days, not quarters. Because there is no dashboard to learn, adoption starts immediately.
What you can do from day one:
Automate PBC collection and evidence retrieval directly from client systems
Run 100% population testing instead of statistical samples
Vouch structured ERP data against unstructured PDF evidence simultaneously
Monitor controls in real time and receive alerts the moment policy drift occurs
Generate first-draft workpapers and memos automatically from completed testing
Conduct predictive risk mapping before the engagement begins
Ready to reclaim 80 to 100 hours per engagement?
Start Your Free Trial or book a personalised demo to see QuaerisAI working through a real audit workflow in under 30 minutes.
QuaerisAI is an Agentic AI platform purpose-built for data-intensive industries. Its Agentic Layer, Semantic Layer, and Converged Search architecture is trusted by audit, finance, insurance, banking, and SaaS teams to activate intelligence across structured data and unstructured documents — with enterprise-grade security and zero hallucination risk